Introduction
It is no surprise that Amazon is now an integral part of many CPG businesses given the sheer amount of money that consumers spend on the website. The recent pandemic has fueled the growth of eCommerce sales, pushing it to newer heights. Amazon online retail sales have increased from $197.35 billion dollars in 2020 to $222.08 billion dollars in 2021 – that’s a 12.5% year-over-year increase. Moreover, the e-commerce giant posted $51.13 billion dollars in net sales in Q1 of 2022 alone.
Every business aspires to do well on Amazon given the amount of revenue one can generate and the number of new customers one can reach on the website. To facilitate that, businesses should track these 3 essential metrics: Buy Box Wins, Sale Trends and Advertising.
1. Tracking Your Buy Box Wins
The majority of sales that occur on Amazon goes to the buy box winner. But what exactly is the buy box? In simple terms, it is the seller that appears on the product detail page near the Add to Cart button when a customer shops for a product. For a single product, there might be multiple sellers, say Seller A, Seller B and Seller C. However, the seller winning the buy box is the most likely to win the sale. In the example below, we can see that the buy box winner for this product is Bluebonnet Nutrition, as evidenced by the name next to “Sold by” and in this case, is the winner of the buy box.
However, this isn’t always the case. If we scroll down the page slightly, you can see that there are in total 8 different sellers (highlighted in red) of this product, most of which are third-party sellers. At any point, Amazon could award the buy box winner spot to any of the 8 different sellers given its sophisticated algorithm we like to call the “secret sauce.”
Why does winning the buy box matter?
Quite simply, those who win the buy box more often achieve greater market share, and more sales. Every buy box loss is an opportunity for your competition. In essence your buy box win percentage is closely correlated to market share. When it’s up, you’re up.
How to win the buy box?
Amazon determines the buy box winner through a complex algorithm. As far as we know, at least 10 metrics go into winning the buy box such as: Seller Status, Product Price, Fulfillment Options, In-stock Consistency, Ship to Customer Promise and so on. However, on the back end there could also be other metrics that determine the buy box win that we aren’t privy to… the “secret sauce” mentioned previously.
Inventory metrics play an outsized role in determining winners and losers, and help Amazon attribute other metrics like In-stock Consistency and Volume with Trustworthiness. Having a habitually out-of-stock ASIN (Amazon Standard Identification Number – essentially a unique number tied to each unique product on Amazon) will ding your brand as you will be seen as unreliable by Amazon, thus losing the buy box. In terms of product pricing, sellers must stay competitive and ensure their product is priced fairly. To stay in the game, it is essential to monitor third-party seller pricing for your product and compare that with your pricing strategy. Ultimately, winning the buy box is a 24/7 endeavor that prompts many brands to seek channel management services that offer proactive strategies to help ensure market share protection against third-party retailers.
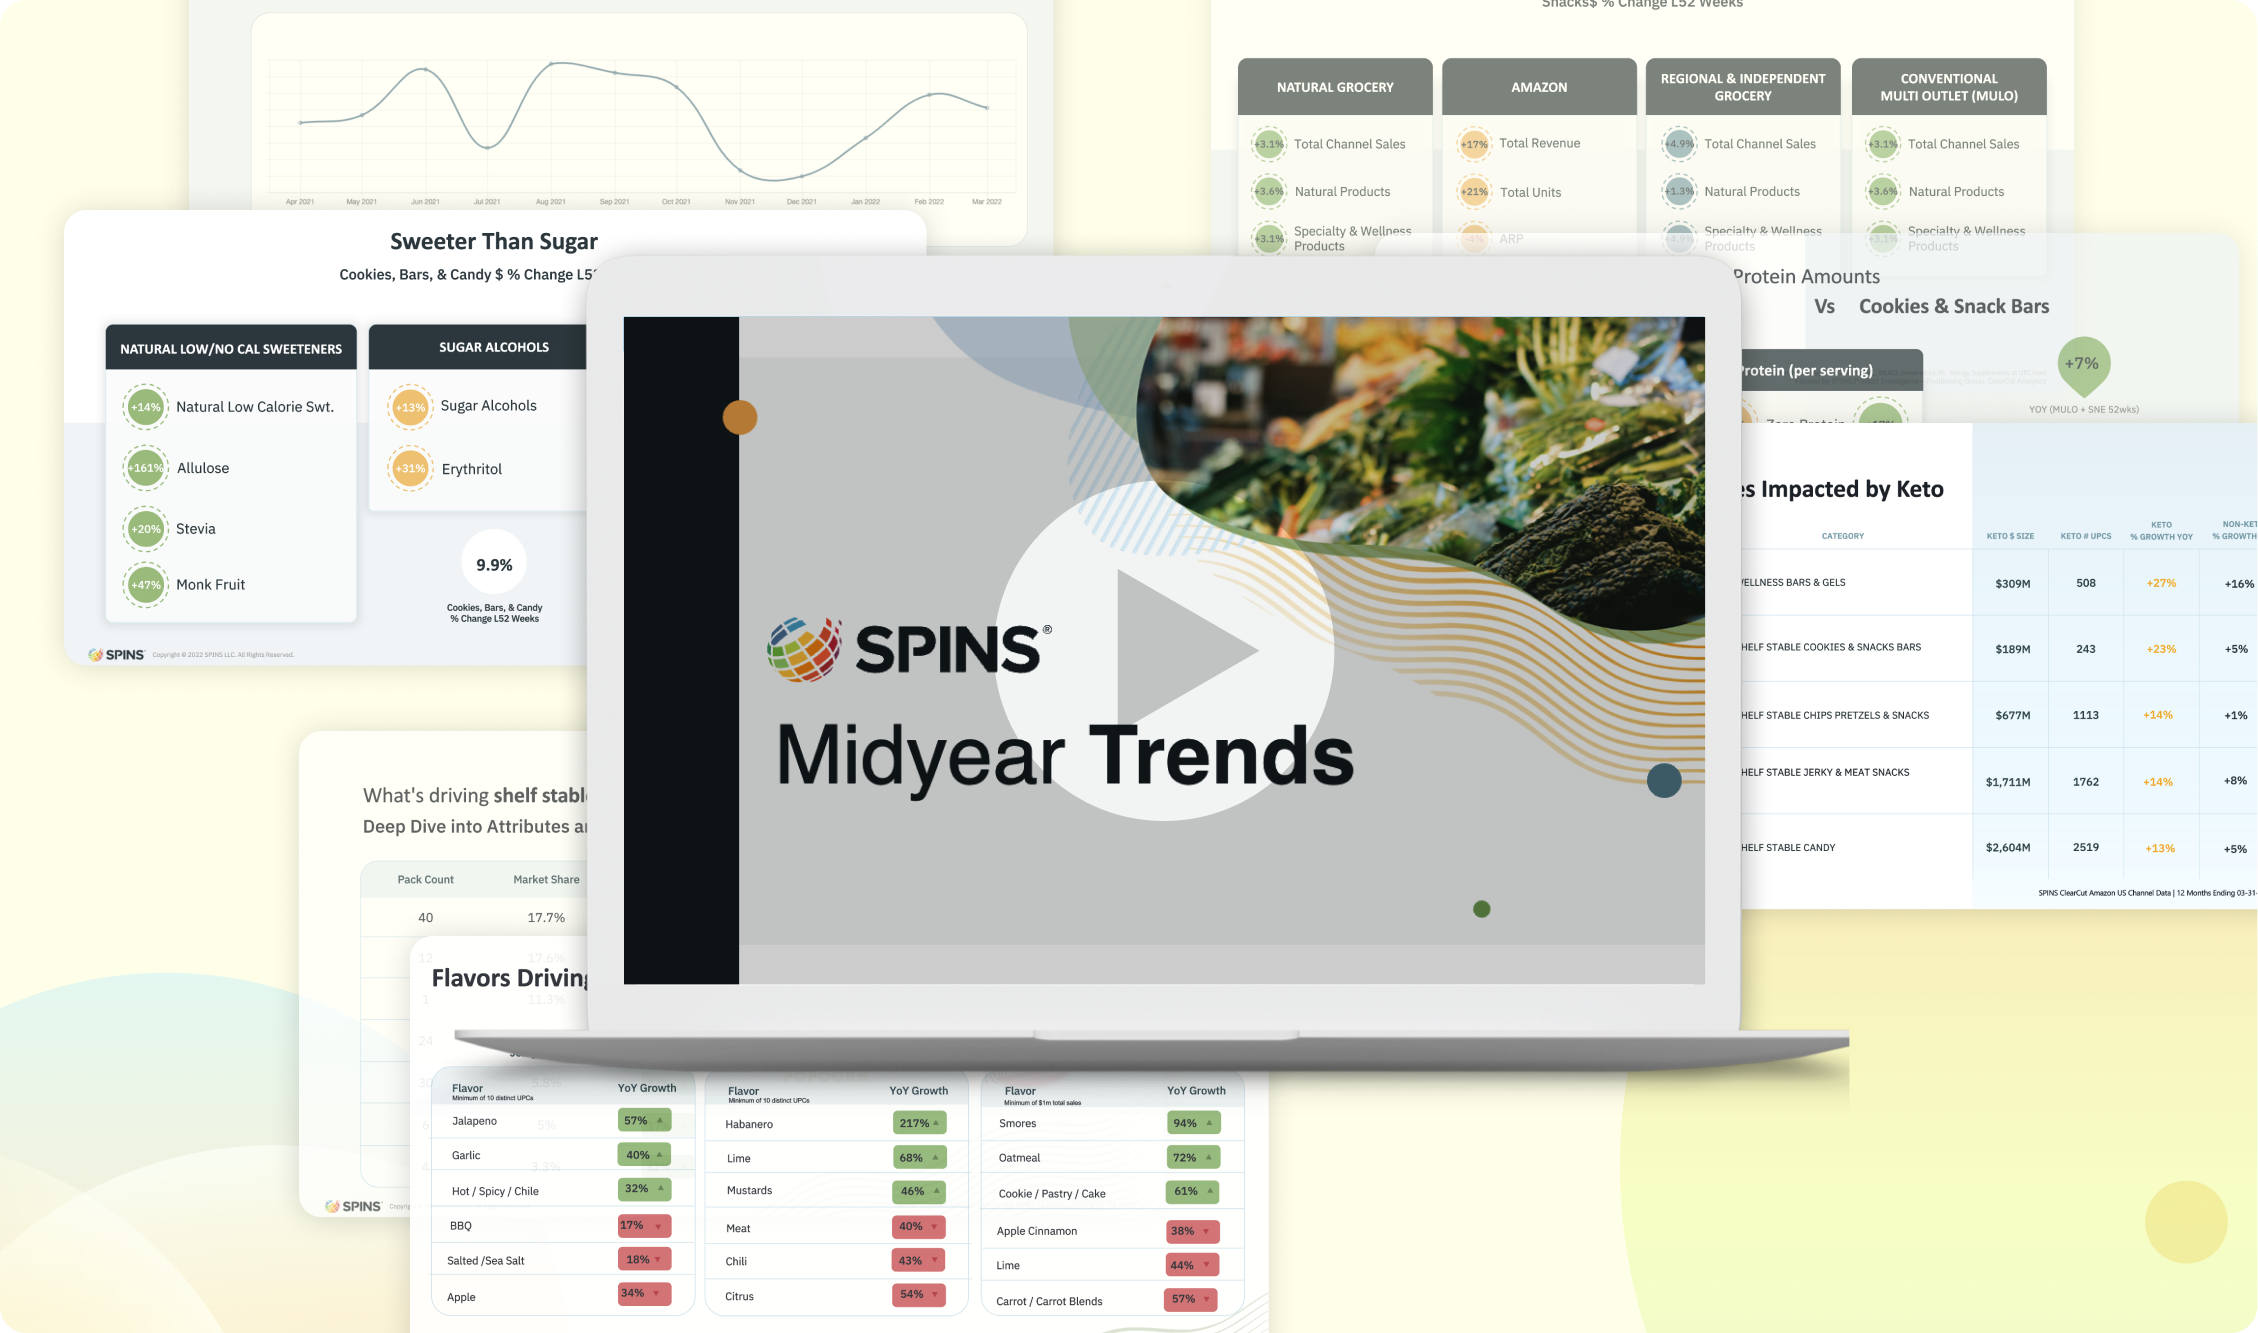
2. The Importance of Your Sales Dashboard
The sales dashboard, just like in a car, is essential for at-a-glance accounting of operations; a reporting system where sellers can see ASIN level sales on a daily, weekly, monthly, and year-over-year basis. You can also find average order value, average selling price as well as the number of units sold. This sales tool is conveniently located on Amazon Seller Central. Though many metrics available on Seller Central are important, the sales dashboard is one that businesses should watch closely.
Why does the sales dashboard matter?
Tracking sales is important because it is how businesses set goals and measure success. Basic metrics on the sales dashboard allows you to see how well your products are performing and can help you determine if changes regarding pricing or advertising need to be made to boost sales. Taking a step further, an insights platform service can be used complementarily with the sales dashboard and will allow you to see more in-depth metrics such as how your product is performing within a specific subcategory, what your market share is, how well you’re performing in comparison to competitors and many more.
With these insights, you’ll be able to gain understanding into how customers are shopping for your products and your competitors’ products. You can filter for products in your category by pack size, flavors, and view competitor product titles to see what is resonating with customers. This then empowers your business with the data needed to make the right decisions ranging from optimizing your Amazon listing to informing future R&D decisions.
In essence, you’ll be able to find opportunities to take advantage of such as growing consumer interest in a certain flavor, or product form. For example, you might be able to see that in the Supplements category, gummies seem to be trending substantially more than capsules therefore you can revisit innovation or add gummies to your product offerings. You can also compare your products with your competitors, and perhaps you’ll see that some of the benefits they list seem to resonate with customers more versus the ones that you have listed.

3. Monitoring Advertising Budgets
Keeping track of your advertising efforts on Amazon is key to making sure that you do well on the platform. There are two main ways of advertising on Amazon and that’s through sponsored brand ads (to increase brand awareness and generate new-to-brand customers) and sponsored product ads (to increase specific product sales). Both of these ad types are set up and optimized by using keyword mining and customer search terms.
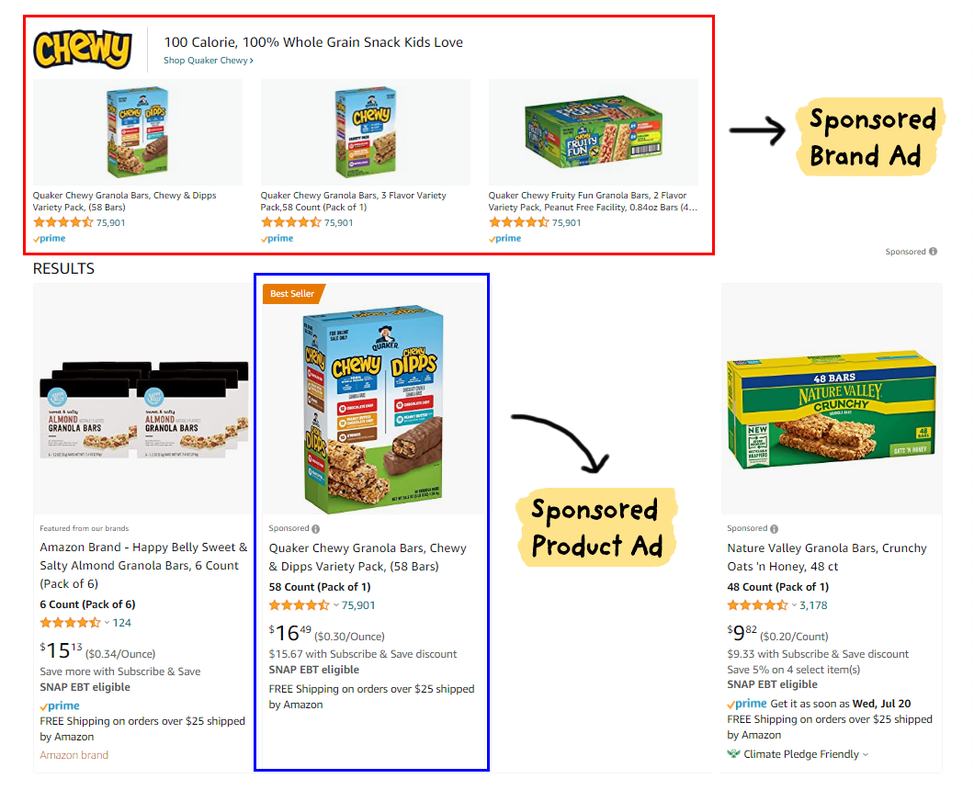
When it comes to budget allocation for these two types of ads, Sponsored Brands vs. Sponsored Products, we often recommend a 30:70 budget split, leaning more heavily on Sponsored Product ads, but tailor this depending on client objectives and goals.
Think of advertising as a funnel. At the top of the funnel would be sponsored brand ads where brands are fighting to raise awareness and attract attention. At the narrower, bottom of the funnel are sponsored product ads where specific customers are ready to purchase – your item, of course.
Ad campaign creation is built upon a foundation of keywords. Account managers utilize proprietary data to analyze the best usage of keywords including how best to optimize bids in what can be a complicated process. For example, you can start broad with a term (“granola bars”) or get granular, such as by flavor (“peanut butter granola bar”), or even take it a step further by narrowing to attribute (“gluten free peanut butter granola bar”). Knowing which consumer segment you want to target and how customers are searching for your products are very important when setting up campaigns. It can be a tedious but necessary process that results in a test-and-learn phase.
Why does monitoring your advertising budgets matter?
When taking on these advertising endeavors, sellers must determine how well their ads are performing to gauge effectiveness. Which keywords are working? Which ones are not? To help analyze this, you should keep track of these two metrics – ROAS and ACOS:
Return On Advertising Spend (ROAS). To calculate this, you take revenue divided by ad spend. It basically tells you how much you earn for every dollar you spend on advertising. This figure changes according to your ad bid amount. Therefore, it is very important to fine-tune your bid amounts to ensure you’re spending efficiently.
Advertising Cost of Sales (ACOS). To calculate this, you take your total ad spend divided by total sales. This formula shows you how much you’re spending on advertising and how much you’re getting back. That’s to say, if selling on Amazon was like driving a car, then ACOS is the “.” while ROAS is the “miles per gallon.”
By tracking these two metrics, you are then able to optimize your keywords more effectively. You’ll also be able to manage which ads require fine-tuning to achieve your desired goals. Quite simply, you want to make sure you’re spending money efficiently when it comes to advertising and watching these metrics will help with that.
Growing Your Business on Amazon
There are multiple paths to gain traction on Amazon. However, the course can seem daunting to many businesses when starting out, even for the most acclimated.
Many brands choose to utilize channel management services to help read the map and navigate the road to success. From advertising consultation services to gaining category data for your own hands-on analysis or simply outsourcing the entire Amazon-side of the business, there is a level of dedicated Amazon experts to manage your every need. To learn more about how we can help your business grow on Amazon, contact us below.