Introduction
Tea has long been a beverage enjoyed by many. From the ever-popular English Breakfast to the iconic matcha, it remains a popular beverage of choice. When it comes to buying shelf-stable tea, meaning teas sold in tea bags, powdered form and etc., it is interesting to see what is resonating with customers. To better understand consumer preferences within the shelf stable tea category, we took a look at the category’s performance over the past 12 months on Amazon. Read on to discover our findings for the category.
Sales in the Shelf Stable Tea Category Grew by 17% YoY Online
As of April 2022, the shelf stable tea category saw a 17% year-over-year increase in revenue on Amazon. During the early months of the pandemic in 2020, sales of tea increased gradually and eventually accelerated as we headed towards the colder months of the year. Tea is typically a category that enjoys a seasonal bump in the winter as consumers crave warm drinks.
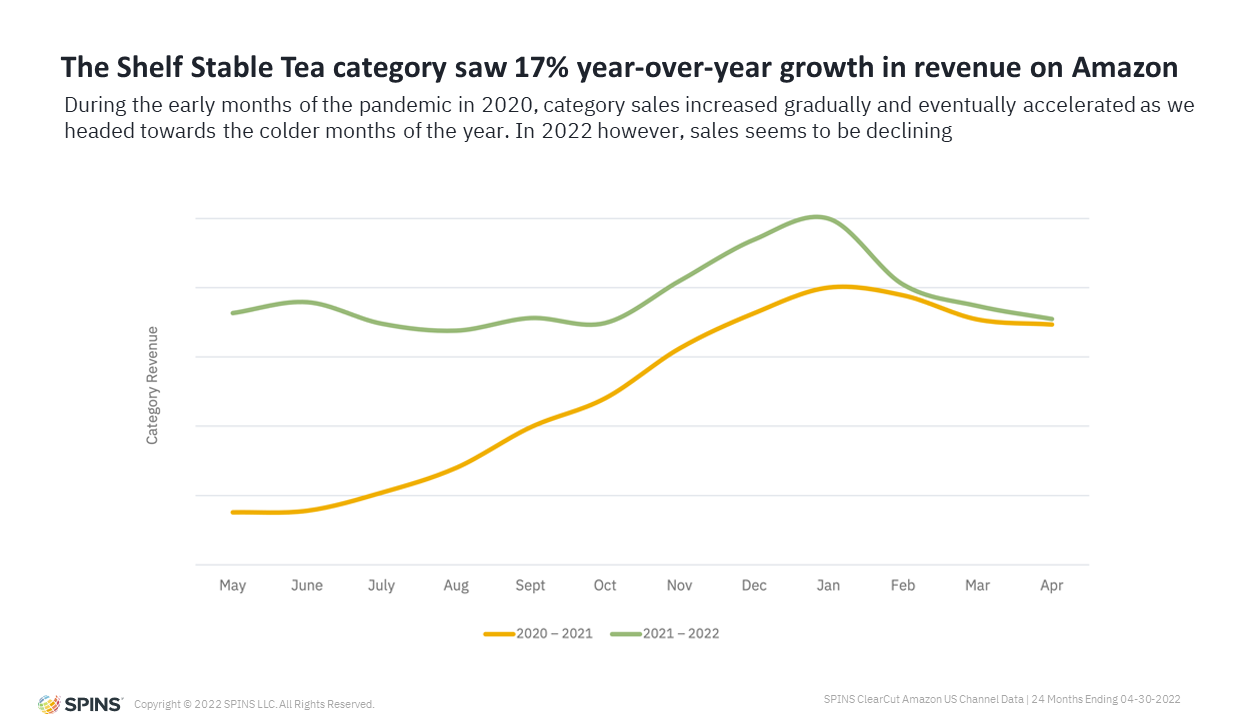

Compared to 2020, shelf stable tea sales were significantly higher in 2021. Due to the pandemic, we’ve seen herbal and wellness teas gain a stronghold in the market as consumers look for teas that may provide immune support or aid in calming as consumers grappled with fear and uncertainty during the pandemic.
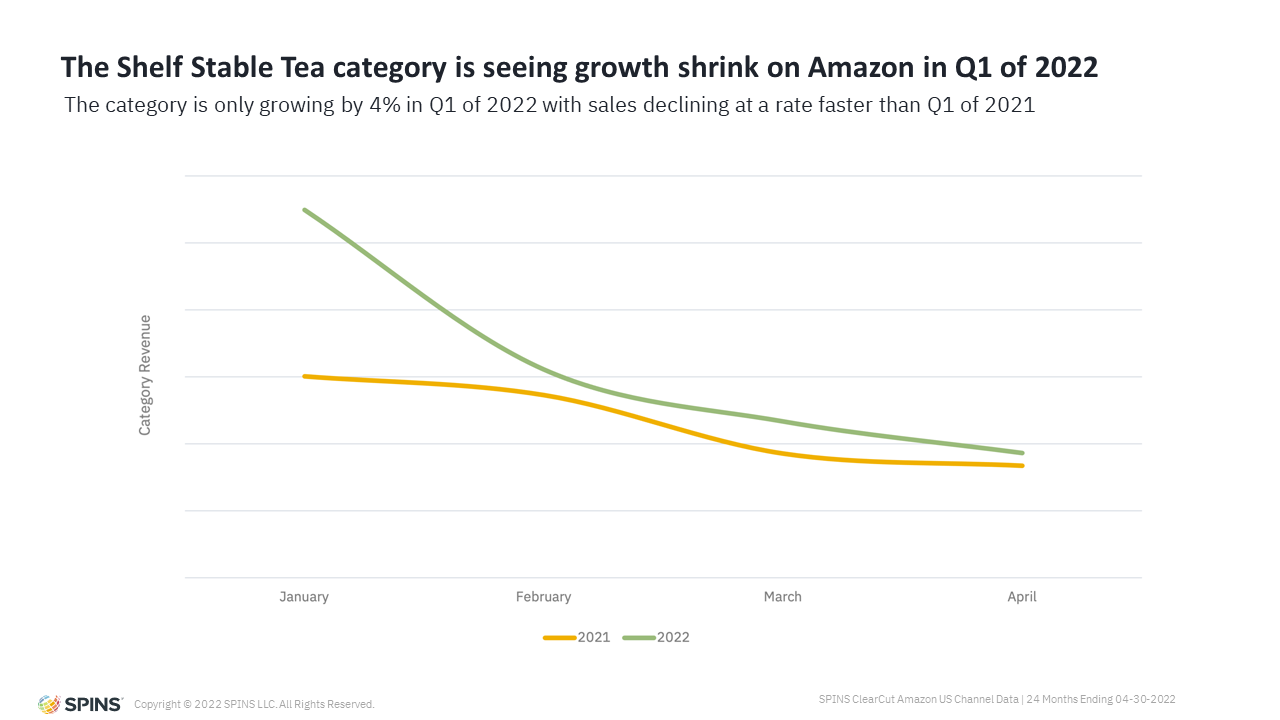
Though some may have expected tea sales to stay stable and follow the same pattern from the previous year, this hasn’t really been the case. In fact, tea sales began to slump significantly after January, declining at a pace much faster than the year prior. By comparing Q1 sales in the graph below, we can see that from February to April, sales growth has shrunk significantly. As we all know, rising inflation and the fallout from supply chain issues could likely be the cause of the slump in sales. Moreover, it could also be why the average price of products for the category has risen 4% over the past year from $16.91 to $17.52.

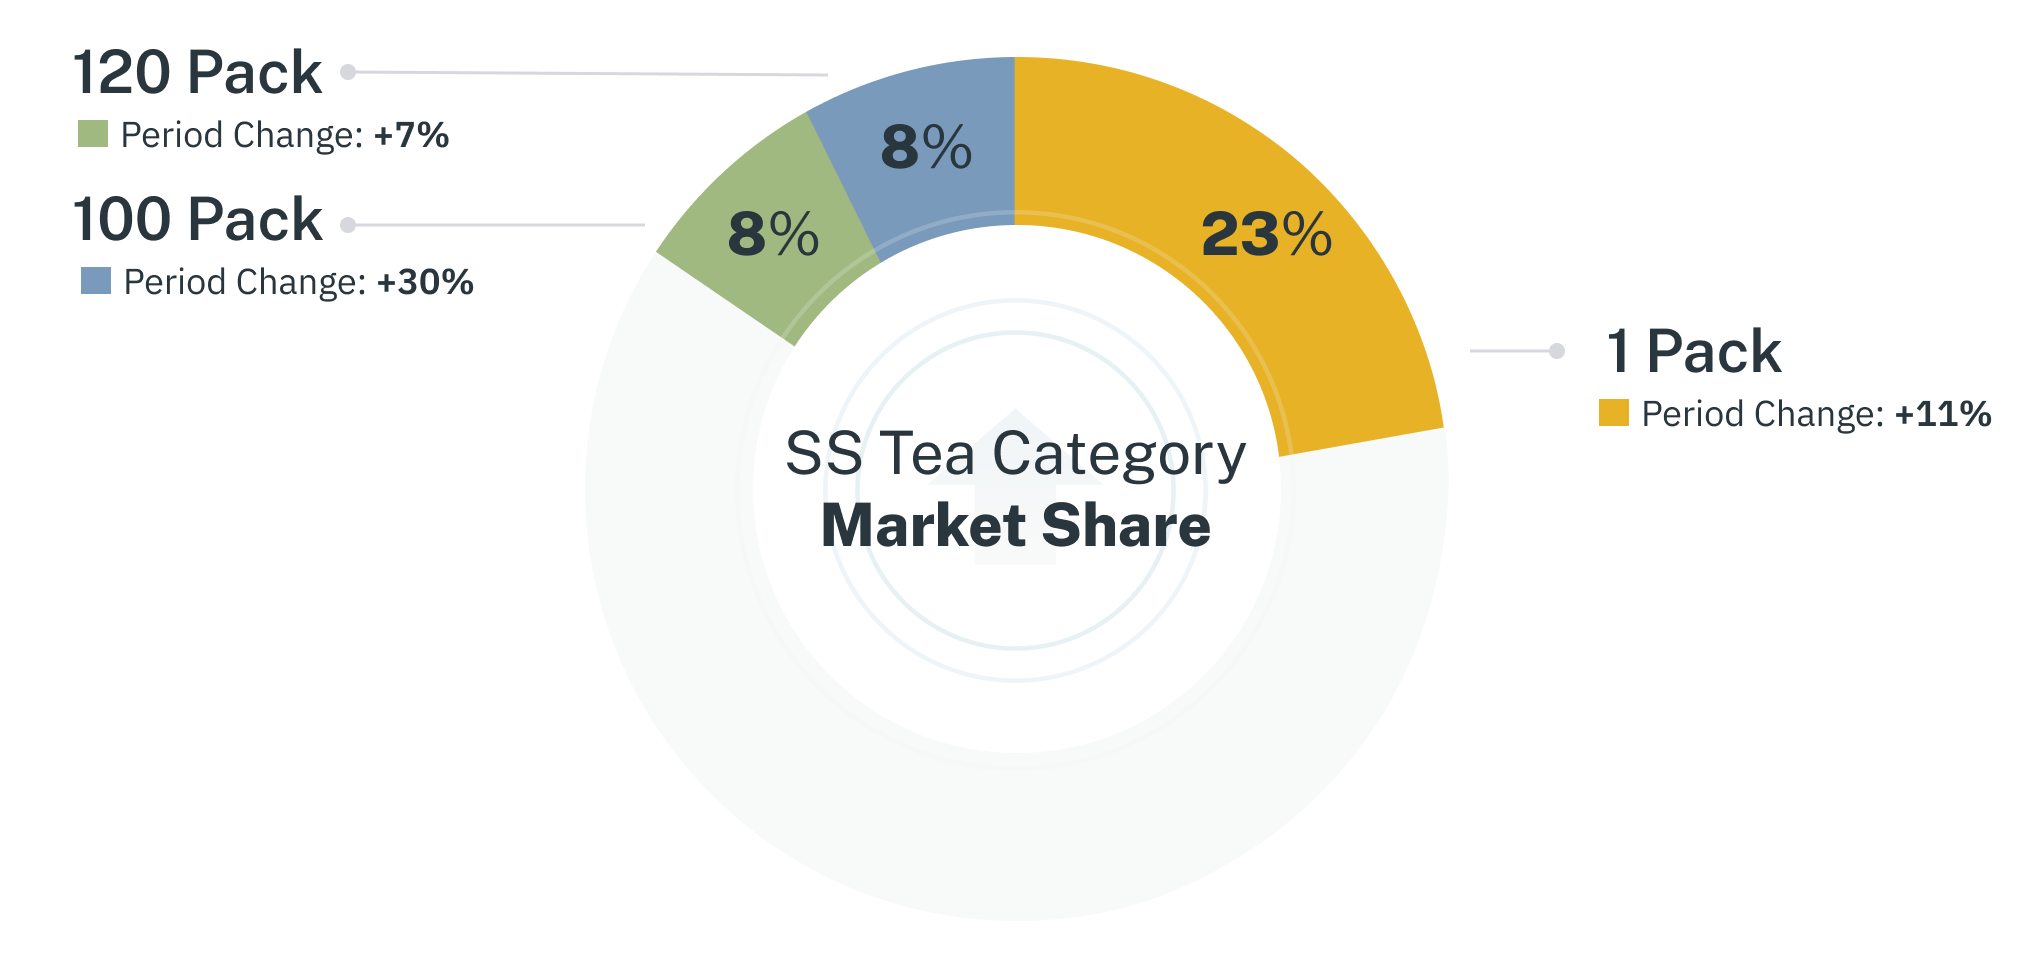
Loose Leaf / Powdered Form Products Account For Most of The Market Share
The top 3 pack counts for the shelf stable tea category is the 1-pack, 120-pack and 100-pack respectively. Here, 1 pack refers to products that come in loose leaf/powdered form. In fact, the 1 pack holds the majority of the market share at 22.6% and is growing at 11%. In the second and third spot is the 120 pack and 100 pack – both of which refers to products that come in packaging such as a box of 120 or 100 tea bags. An important thing to note here is that 100-pack count products are growing at 30%, that’s more than 4 times the amount of the 120-pack count that sits in second place. Given the current growth rate and the small gap between market share, the 100 pack could easily take over the second place.
Tea Bags Dominate In Most Subcategories Except For Green & White Tea
When taking a look at tea bags (includes pods as well) vs. loose, it is evident from looking at the top 5 subcategories that more consumers choose the convenient tea bag/pod compared to loose leaf products.
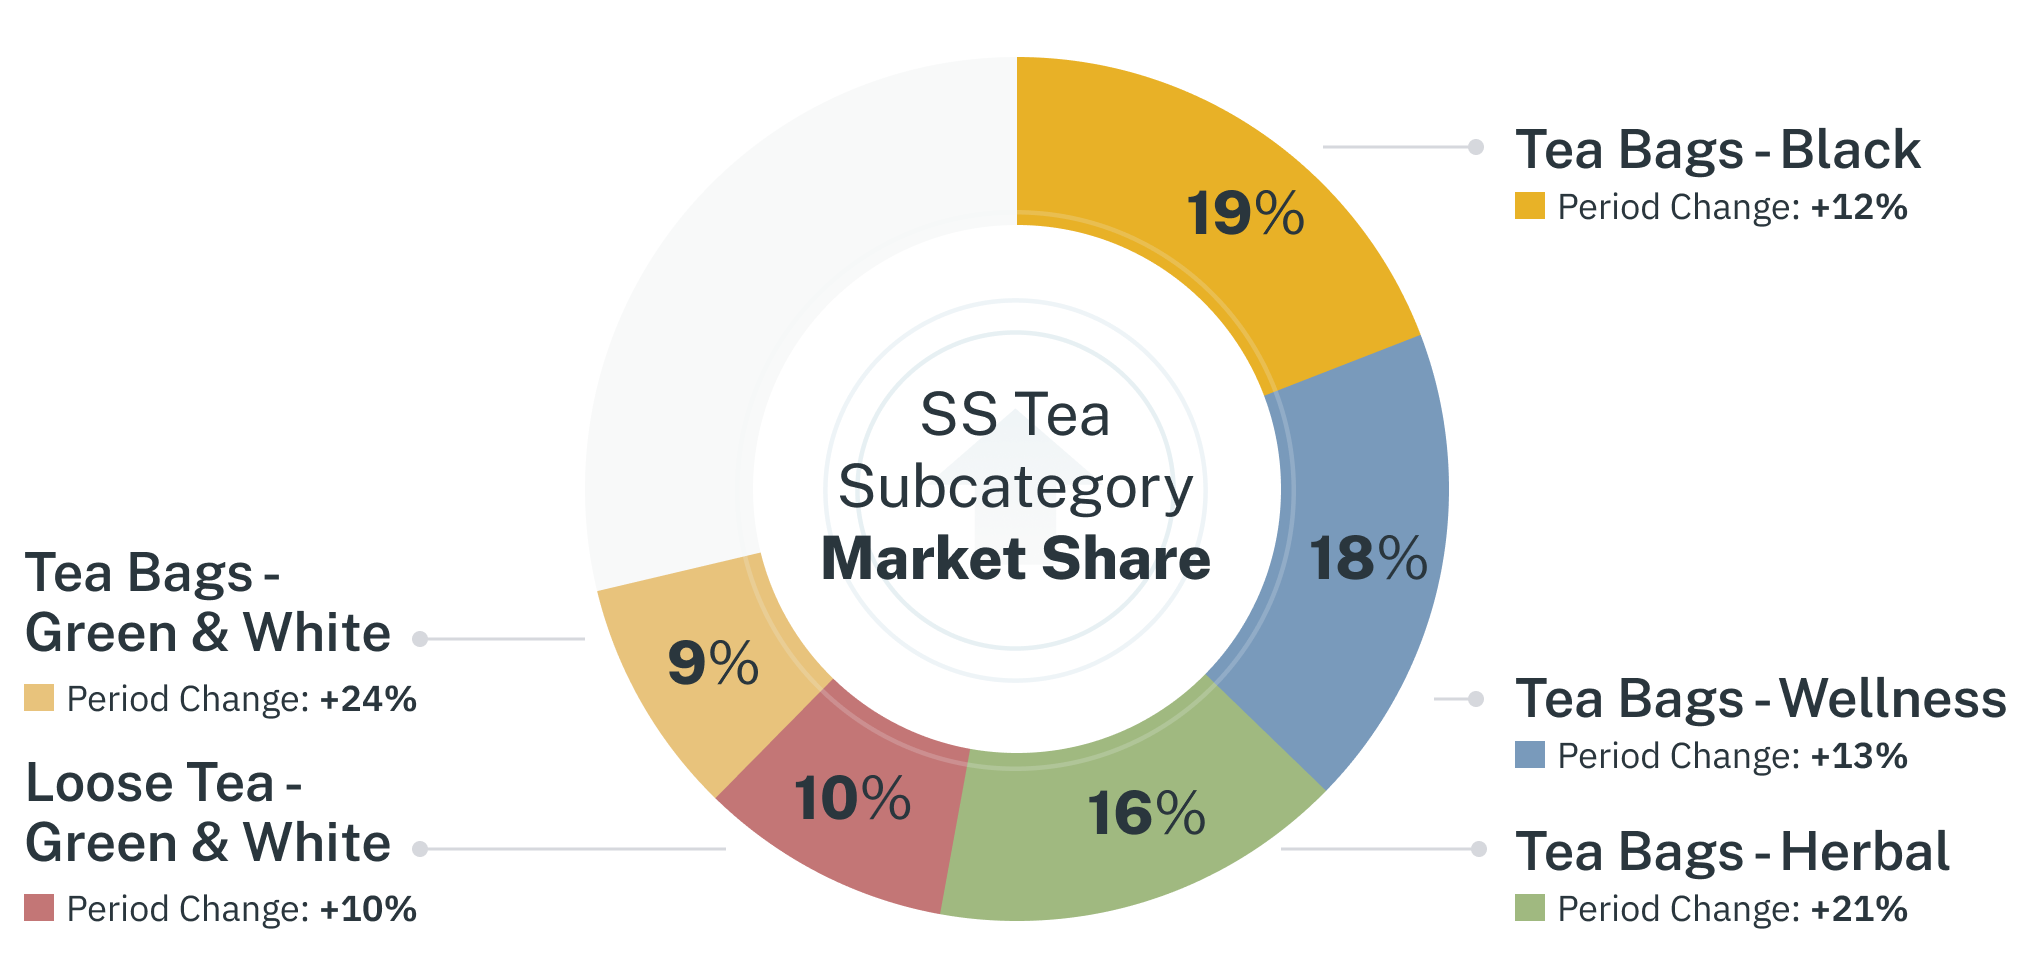
The one outlier here is the green & white tea subcategory where the loose form of the product edges out over the tea bag/pod form. It is important to note that for green tea in particular, the powdered form is used regularly not only to make beverages, but it is also used in desserts which could be why sales of loose green & white tea is higher than its tea bag/pods counterpart.
As we continue to watch the shelf stable tea category closely it will be interesting to see if these trends will continue to hold strong for the rest of the year.
Interested in learning more about these insights and where your brand stands compared to the broader category? Contact us today.