
The Next Growth Engine Is Already Here
The consumer landscape is changing rapidly, driven by the behaviors, preferences, and values of Millennials and Gen Z. These next-generation buyers are not only reshaping how products are marketed and sold but also redefining the very nature of consumption itself. Their choices reflect intentionality: what they eat, the ingredients they avoid, the places they shop, and the prices they are willing to pay all reflect a deep awareness and evolving mindset.
We used a wide variety of data sources to understand consumer trends. We chose to focus on younger consumers (Millennials and Gen Z) as they continue to have growing purchasing power and will be leading the industry for the foreseeable future. This report indicates their shopping and product preferences, giving signals on what’s to come.
How We Built This View
Our analysis triangulates attitudes and actions to ensure a comprehensive view:
- SPINS surveys: July 2025 Gen Z & Millennial shoppers (n=1,000) and May 2025 total U.S. VMS shoppers (n=1,000).
- Retail behaviors: SPINS POS data | Total US Natural Expanded & MULO Conventional (powered by Circana), 52 weeks ending 07/13/2025.
- Household adoption and spend: SPINS TriLens Panel, Total U.S.—All Outlets.
- Price dynamics: Price Intelligence, Datasembly Grocery Price Index
Inside the Minds of Next-Gen Buyers
Diets by Choice, Labels by Design
Nearly 40% of Millennials and Gen Z are choosing to follow a specialty diet—by choice, not necessity. This is a dramatic shift that reflects how much more invested these generations are in food as part of their lifestyle and identity. High-protein and low-carb diets are particularly influential: more than half of both groups report following a high-protein diet.
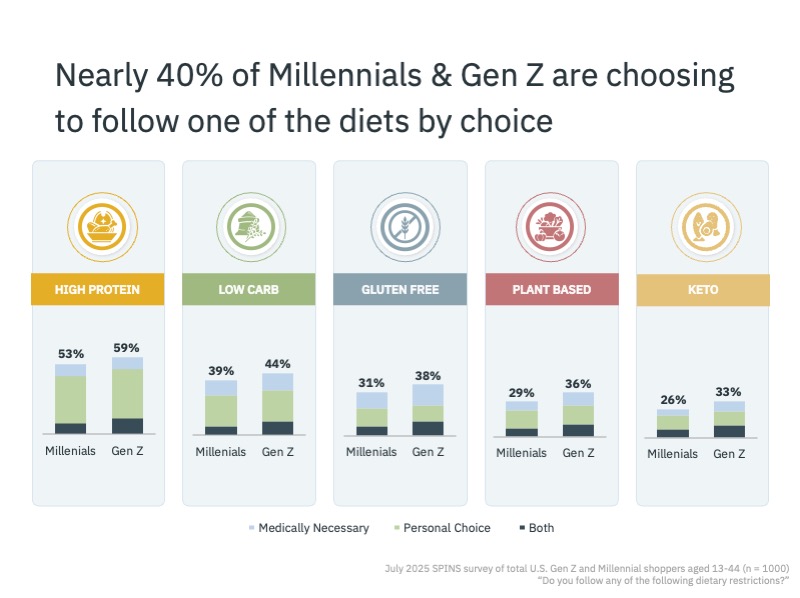
Interestingly, Gen Z is adopting specialty diets at a higher rate than Millennials, across the board. This signals that dietary alignment is becoming a baseline expectation for the youngest consumers rather than a fringe behavior.
For CPG brands, this is a call to action. Diet-forward product innovation and marketing are no longer niche strategies—they are mainstream necessities if you want to connect with next-gen buyers.
Ingredient Transparency Matters
Dietary choices are just the beginning. Millennials and Gen Z are also vigilant about the ingredients they avoid. An astounding 90% of them are deliberately cutting out specific ingredients from their diets and personal care routines.
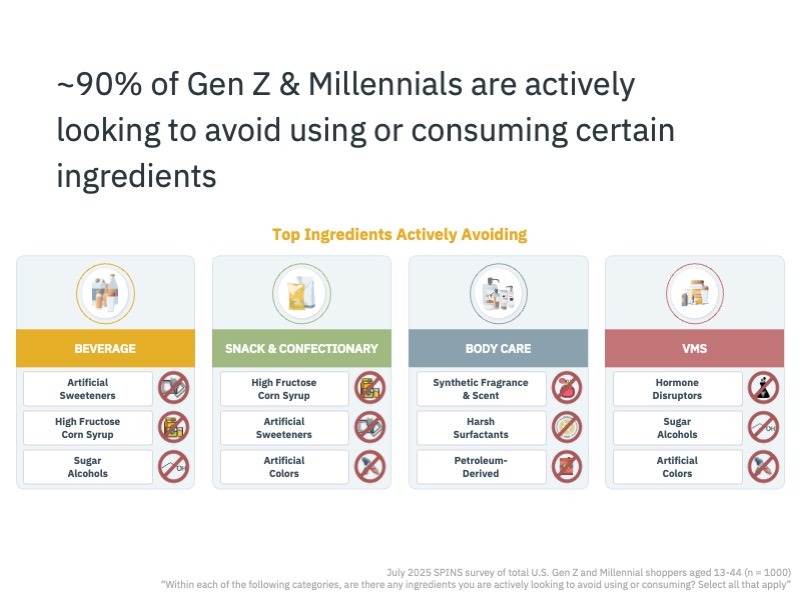
In beverages, sugar and its substitutes top the list of avoided ingredients, with artificial sweeteners, high fructose corn syrup, and sugar alcohols all under scrutiny. In body care, the focus is on avoiding synthetic or petroleum-based ingredients, harsh surfactants, and unnecessary fragrances. Across categories, the theme is clear: consumers are prioritizing quality, transparency, and integrity over convenience or legacy brand loyalty.
For brands, this means that “clean label” isn’t just a trend—it’s the new standard. The next generation of consumers are researchers and label-readers, and they expect honesty and clarity from the products they purchase.
Intentional, Multi-Channel, and Discovery-Driven
Younger consumers are also redefining retail shopping behavior. Instead of the one-stop shop, Millennials and Gen Z are spreading their purchases across multiple destinations—80% shop two to three different stores weekly. 30 to 40% of Gen Z and Millennials are shopping at natural and organic retailers and local farmers’ markets.
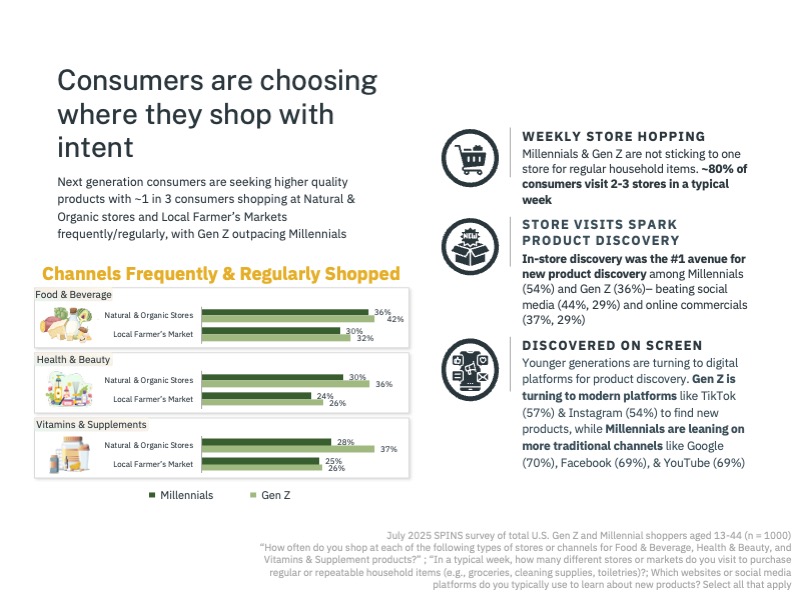
This intentionality carries into discovery. In-store visits remain the leading way Millennials and Gen Z discover new products, surpassing even social media and digital advertising. That said, digital platforms remain critical. Gen Z favors TikTok and Instagram, while Millennials lean more toward Google, Facebook, and YouTube. The lesson for brands is clear: retail experience and social discovery are deeply interconnected, and both must be optimized to capture attention.
Value Discipline Shapes Trips, Baskets, and Trade-offs
Despite their values-driven approach, Millennials and Gen Z remain cost-conscious. Price is a powerful driver of shopping behavior, especially as many are balancing limited disposable income or new family budgets.
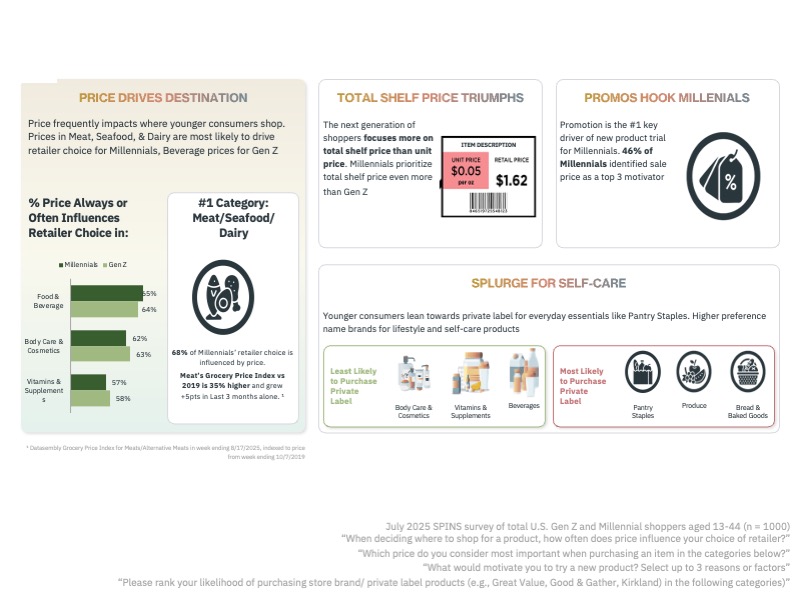
For Millennials, the cost of meat, seafood, and dairy heavily influences shopping destinations. Meat prices have increased by 35% in the past three months alone, which suggests that these consumers are very mindful as well as conscious about where they’re shopping. For Gen Z on the other hand, beverage prices heavily influence shopping destinations.
When thinking about pricing as a whole, younger consumers tend to focus on total shelf price rather than unit or price per serving. This means strategies like shrinkflation may have more impact than straightforward price increases, as the final number on the shelf carries more weight. Promotions are also highly effective, with millennials in particular citing discounts as the leading driver of new product trial.
Their willingness to spend strategically is also noteworthy: next-gen consumers turn to private label products for commodity items like pantry staples, produce, and baked goods, but are willing to splurge on branded items in lifestyle and self-care categories such as cosmetics, body care, beverages, and supplements. This duality suggests a nuanced approach—private label isn’t viewed as second-best, but rather as a smart way to save, while branded products signal value, trust, or personal identity.

Preferences with Staying Power: Health and Nutrition, Re-Centered
As Millennials and Gen Z continue to grow their purchasing power, their preferences are no passing fad. These behaviors are grounded in deeply personal values around health, wellness, and self-expression, making them long-term drivers of the consumer packaged goods (CPG) market. In this section, we’ll dive into the trends with true staying power—spanning supplements, personalized routines, and the evolving definition of beauty.
Personalized Routines with Staying Power
The concept of “hacking health” has moved beyond buzzword status. For Millennials and Gen Z, personalized health routines are essential, and supplements are at the center of this movement. Earlier conversations around healthspan have evolved into practical, everyday habits: vitamins, minerals, and supplements (VMS) are the go-to tools for these consumers.
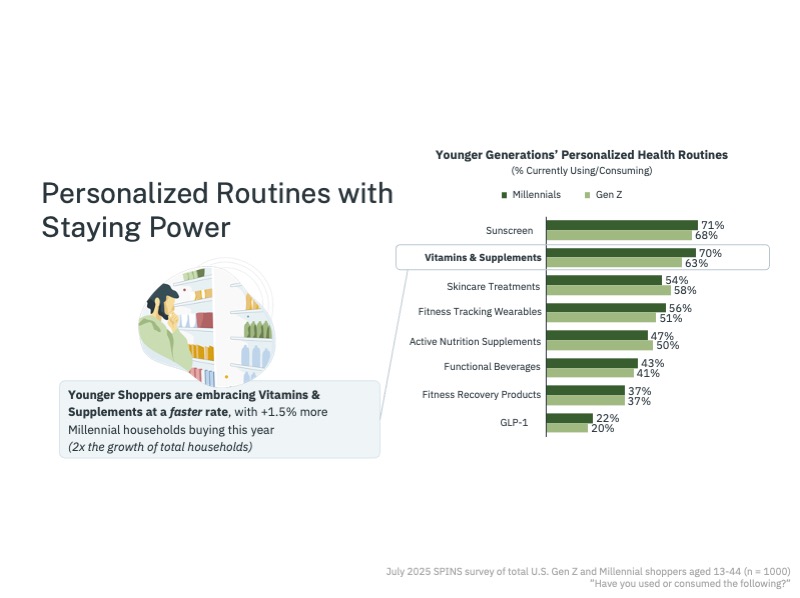
Household penetration data reinforces this behavior. Millennial households, in particular, are adopting vitamins and supplements at a faster rate than average, 2x the growth of total households. This signals both a commitment to preventive health and a growing market opportunity. While younger consumers also embrace skincare regimens, wearables, fitness recovery tools, and even GLP-1s, supplements remain the consistent anchor in their wellness routines.
For brands, this underscores the importance of innovation in VMS, not only with functional formulations but also with tailored solutions that meet individual needs. Personalization, whether through packaging, digital tools, or subscription models, will define which brands maintain relevance.
Health and Wellness Concerns Across Generations
Some wellness concerns remain universal. Consumers of all ages continue to prioritize immune support and digestive health, core needs that cut across life stages. But when it comes to next-gen shoppers, distinct priorities emerge.
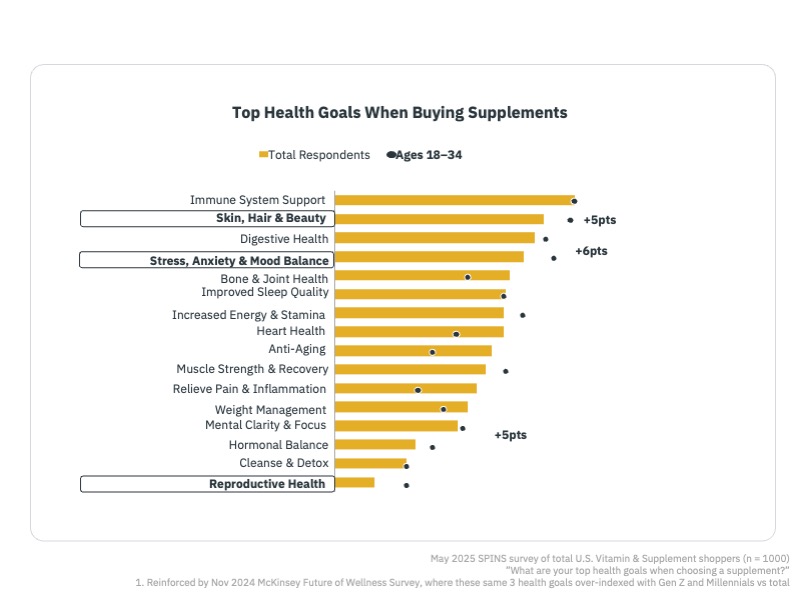
For Gen Z and younger Millennials, reproductive health, stress management, and skin and hair care take precedence. Unlike older generations, anti-aging, heart health, or joint support aren’t yet top of mind. This makes sense given their life stage, but it also highlights how brands must adjust messaging and innovation to meet their immediate needs, rather than assuming a one-size-fits-all health narrative.
The takeaway: younger consumers want products that address both the physical and emotional dimensions of wellness. Stress relief, appearance-based benefits, and reproductive health solutions resonate more strongly with them than traditional wellness categories.
Skincare Gets Personal and Generational
Skin care has quickly become one of the most dynamic categories for younger consumers, and it’s deeply personal. Like VMS, the space is marked by information overload, with countless ingredients and product claims to sift through. To navigate this, Millennials and Gen Z are turning to personalization.
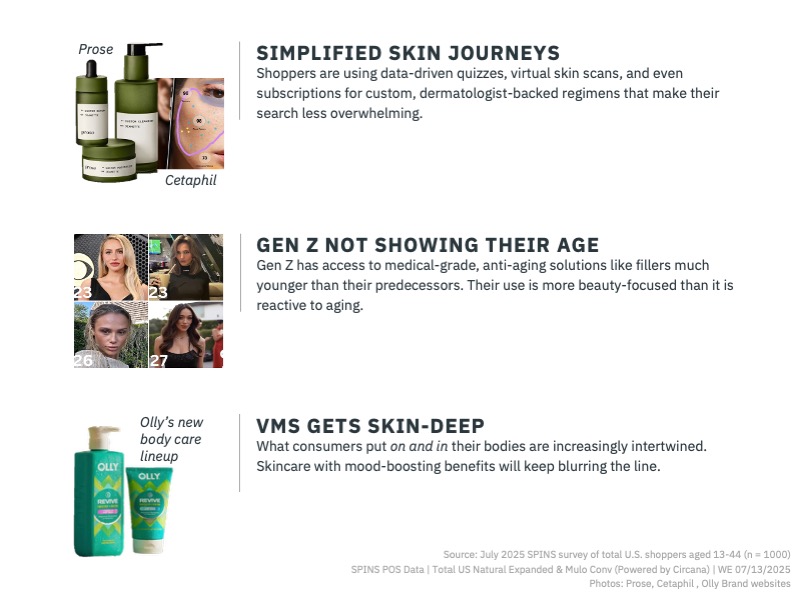
From quizzes that build custom routines to facial scans that generate data-backed recommendations, consumers are gravitating toward solutions that simplify choice and make products feel tailored to them. Subscription models like Prose are capitalizing on this need, offering hyper-personalized solutions that feel both practical and premium.
Social media plays an outsized role in this journey: 31% of consumers under 45 use it to discover new products, with TikTok, Instagram, and YouTube leading the charge. This influence extends well beyond discovery. We see trends like “Sephora tweens” shaping beauty culture earlier than ever, with kids as young as nine influencing household purchases. At the other end, Gen Z is normalizing everything from acne patches to early adoption of fillers, reflecting a proactive, aesthetic-first approach to skincare rather than a reactive one.
Perhaps most importantly, skincare is colliding with nutrition. Younger consumers are increasingly embracing “inside-out beauty,” seeking skin benefits through supplements, while also welcoming “outside-in” innovations such as mood-boosting or stress-relieving body care products. Brands like Olly are already blurring these lines, and the trend will only accelerate. For CPG companies, this means thinking beyond category silos and recognizing that beauty, wellness, and nutrition are no longer distinct paths—they are one interconnected consumer journey.
Managing Stress & Anxiety
After skincare, managing stress and anxiety ranks as the third most important health goal for younger consumers. While vitamins and supplements remain a go-to solution, there’s also a concerning parallel trend: nicotine use. E-cigarettes, vapes, pouches, and even traditional cigarettes are making a comeback among Millennials and Gen Z, reflecting both social influence and the rise of “Zynfluencers” promoting nicotine pouch use on TikTok and Instagram.
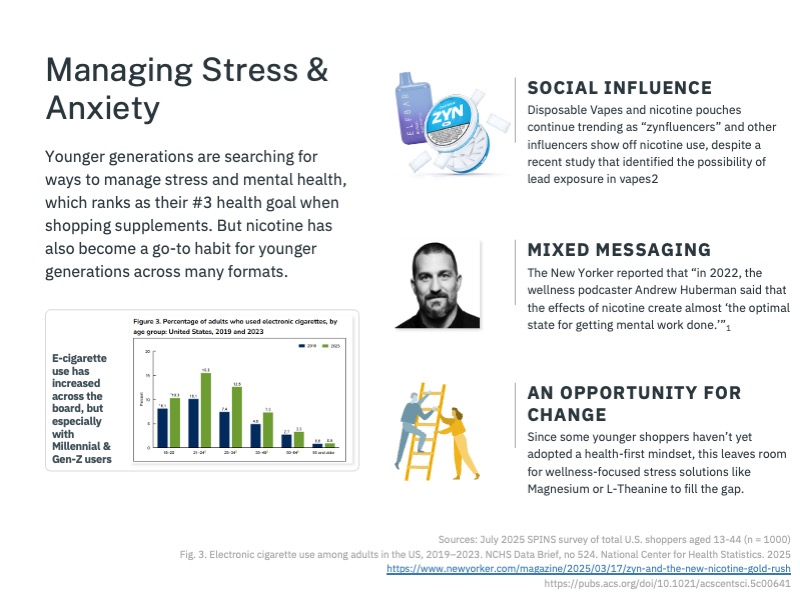
This resurgence is happening despite warnings about health risks, such as potential lead exposure in vapes. Mixed messaging from public figures and media complicates the issue further. Anti-smoking campaigns clash with high-profile voices praising nicotine’s ability to enhance focus and productivity.
For CPG brands and wellness companies, this presents a white-space opportunity. As younger consumers mature and shift toward long-term health goals, they will increasingly seek healthier stress-management tools. Ingredients like magnesium, L-theanine, and ashwagandha are poised to fill this demand, creating room for innovation in wellness-oriented stress and anxiety solutions.
AI as the New Personal Nutritionist
Artificial intelligence is rapidly becoming a trusted advisor for next-gen consumers. In fact, 18% of Gen Z and 13% of Millennials report using AI chatbots to learn about products. With barriers to personalized nutrition advice such as cost and accessibility, AI offers a scalable, affordable, and highly personalized alternative.
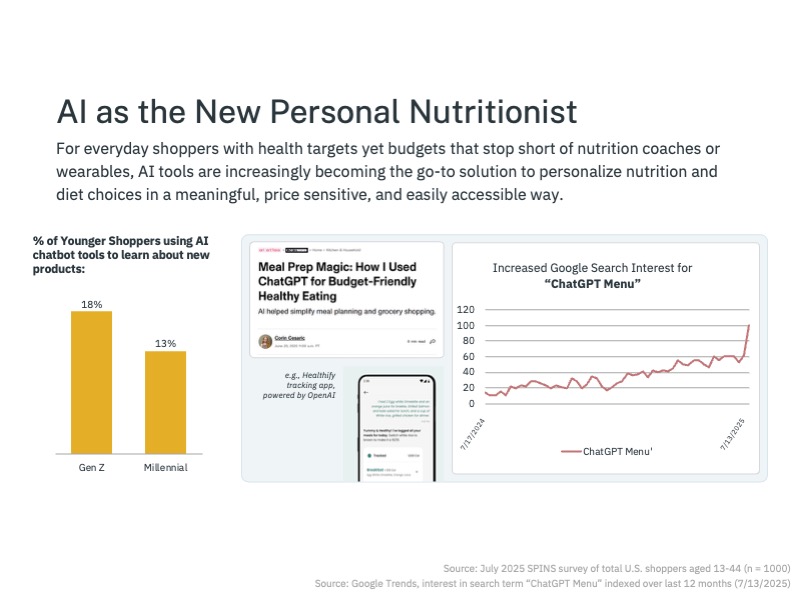
Consumers are already turning to AI-driven apps, tools, and even search trends. The fact that there are numerous articles being published in popular media covering the topic illustrates how mainstream this is becoming. Google searches for “ChatGPT menu” have surged over the past year, reflecting the rising curiosity around AI-powered diet planning.
As AI tools evolve, they will increasingly shape how consumers approach health and nutrition. For brands, this underscores the importance of integrating personalization and tech-enabled experiences into their products and marketing strategies.
Key Nutrients Take Center Stage
Nutrient density has moved into the spotlight, with younger consumers tailoring their diets around fiber, protein, and other essential nutrients. Once confined to fortified foods like cereal, bread, and milk, nutrient callouts are now spreading across categories—from frozen foods to pasta.
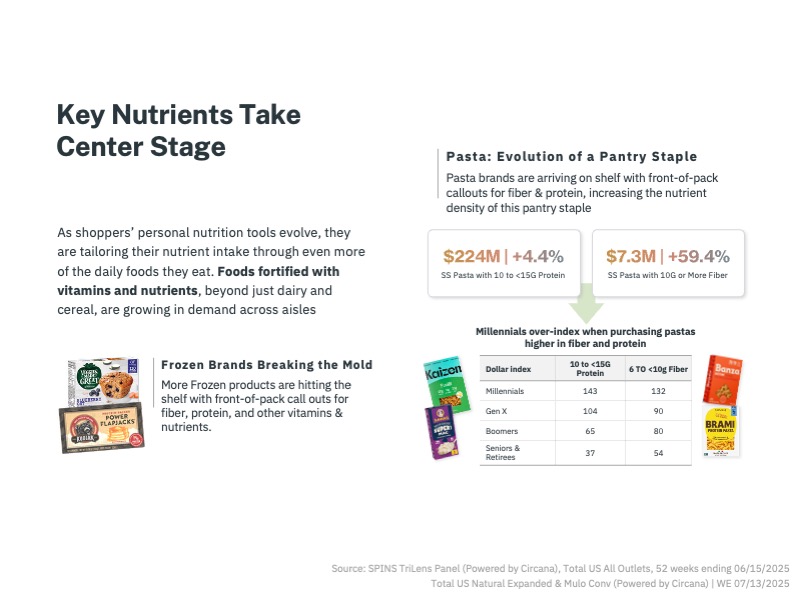
Protein- and fiber-forward pastas are growing rapidly, with protein pasta sales up 4.4% and fiber-rich options up 59.4%, despite being a relatively small $7.3M segment. Millennials, in particular, are over-indexing in purchases of high-fiber and high-protein options, highlighting their demand for nutrient-dense everyday staples.
Back to Protein Basics
Protein remains a cornerstone of dietary choices for Millennials and Gen Z. More than half report following a high-protein diet, though only a third commit to plant-based eating. Instead of aligning strictly with plant- or animal-based diets, younger consumers are focused on increasing total protein intake from a variety of sources.
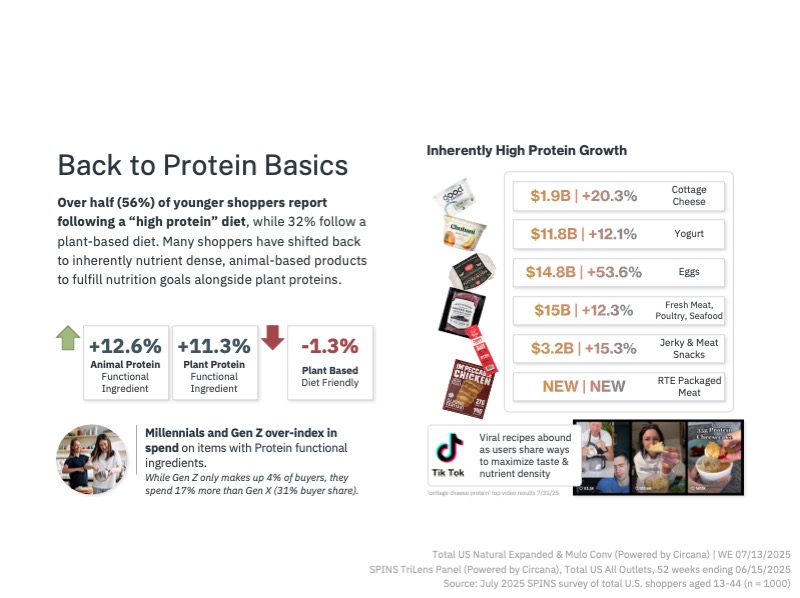
Functional ingredient data reinforces this trend: animal proteins are up 12.6%, while plant proteins are up 11.3%. High-protein categories like yogurt, eggs, meat, seafood, and jerky are growing strongly, while new formats, such as ready-to-eat packaged chicken breast, are emerging as convenient protein alternatives.
Gen Z, though a smaller proportion of buyers, is spending 17% more than Gen X on products with protein functional ingredients. For brands, this signals that protein-forward innovation will continue to be a winning strategy across both traditional and emerging categories.
Next in Nutrient Density: Fiber’s Moment
While protein has long dominated nutrition conversations, fiber is having a renaissance. Social media-driven trends like “fiber maxing” have brought digestion and gut health into mainstream focus, creating a powerful one-two punch when paired with protein.
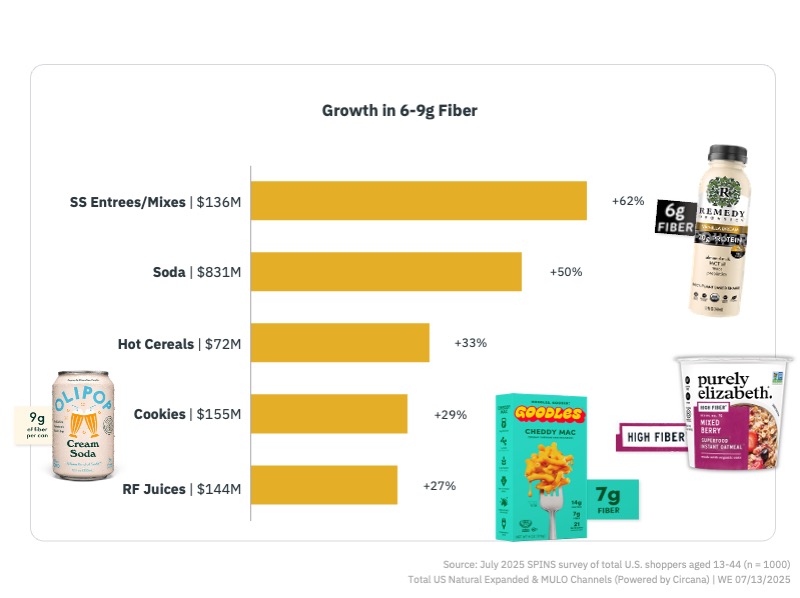
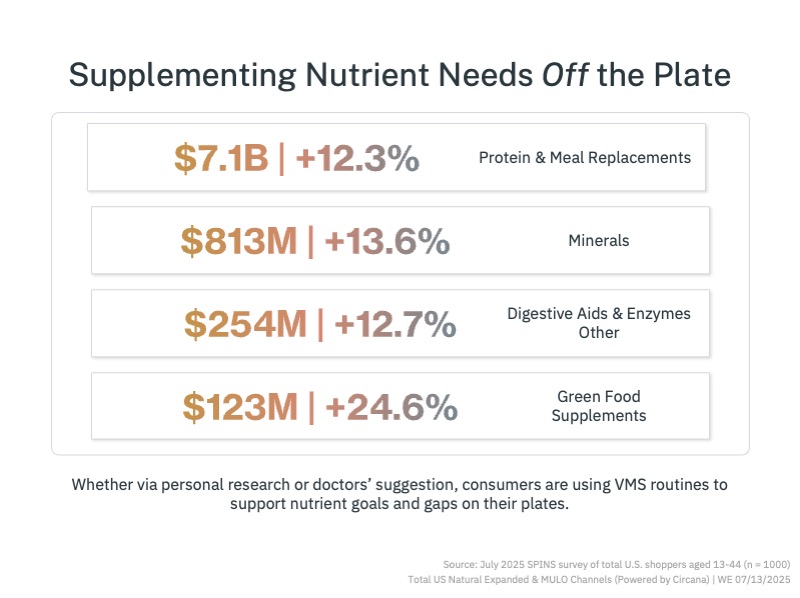
Fiber is now appearing in unexpected categories. Cookies with added fiber are up 29% year over year, and even sodas are being reformulated with digestive benefits in mind. Consumers are also supplementing fiber intake off the plate, using VMS products to fill nutritional gaps.
This shift illustrates how nutrient density is becoming a lifestyle driver—one that influences both food innovation and supplement choices.
Consumers’ Supplement Focuses Are Ever-Evolving
Supplement trends provide a window into how consumer priorities are shifting. Hydration, performance, and mood support remain top categories, fueled by younger buyers who are not only experimenting but becoming repeat purchasers. Heart health and reproductive health are also emerging as growing supplement focuses, reflecting both generational needs and life-stage transitions.
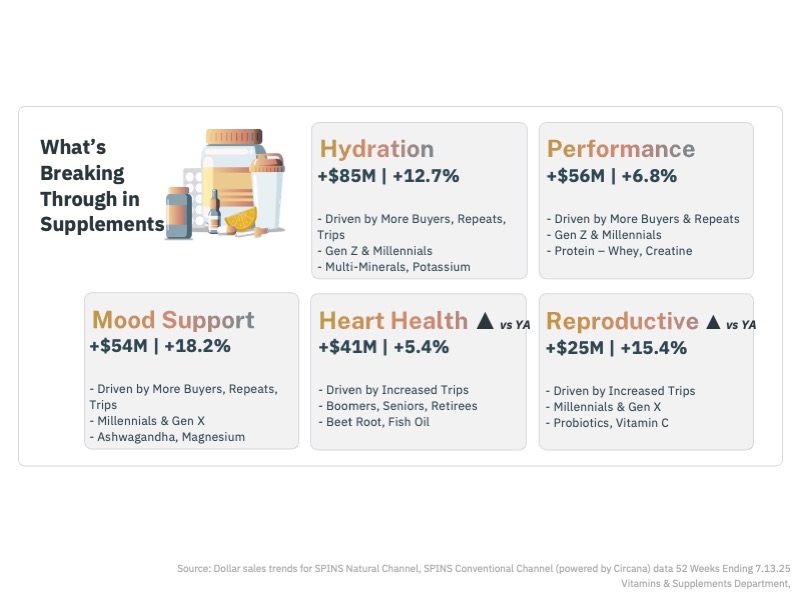
These categories represent more than short-term spikes; they point to enduring demand patterns that are likely to trickle down into food and beverage innovation. Functional beverages, snacks, and fortified foods are already echoing many of the same themes.
Consumers’ Supplement Focuses Are Ever-Shifting
While some supplement categories are fading, the underlying needs remain strong—they are simply being met in new ways. Cold and flu supplements, for example, are declining, but consumers are instead turning to functional beverages and shots. Weight-loss supplements are falling, but interest in medical solutions like GLP-1s is rising.
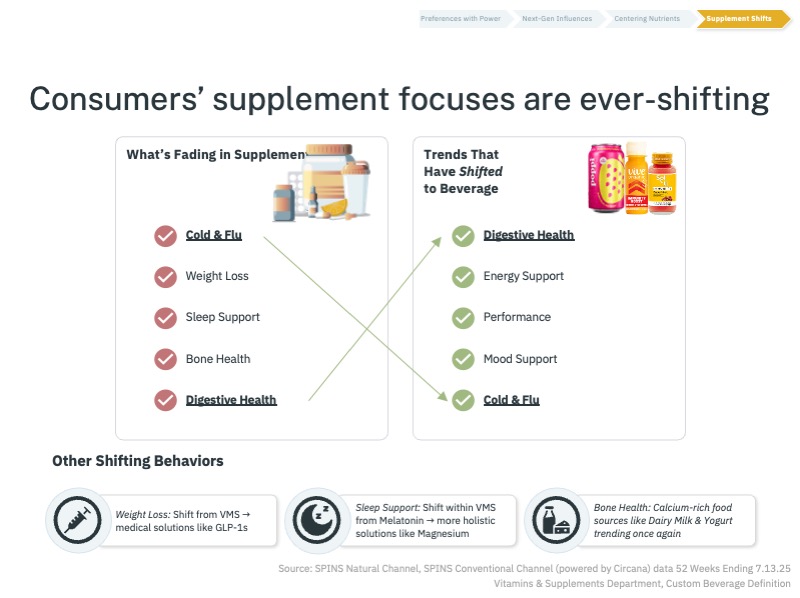
Other shifts are more nuanced. Sleep support is moving away from melatonin dominance toward magnesium and holistic nighttime rituals, while bone health is being addressed through calcium-rich, high-protein foods rather than pills. These shifts emphasize a broader consumer trend: preference for functional foods and beverages that deliver health benefits in everyday formats.
The Art & Science of Being Ready: Reinventing the Modern Kitchen
The modern kitchen is no longer defined by a fixed set of staples. For Millennials and Gen Z, it has become a stage for experimentation, where global flavors, adventurous textures, and functional ingredients meet.
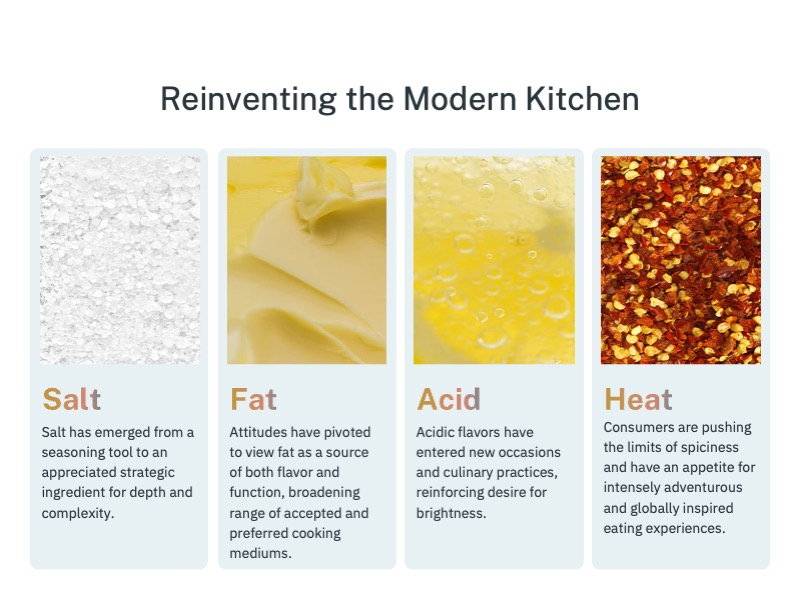
This reinvention is reshaping not only how consumers cook at home but also how they engage with packaged goods and culinary innovation. Using the four culinary pillars: salt, fat, acid, and heat, as a framework, we can see how these shifts represent both cultural exploration and health-driven decision-making.
Global Inspiration Unlocks New Possibilities
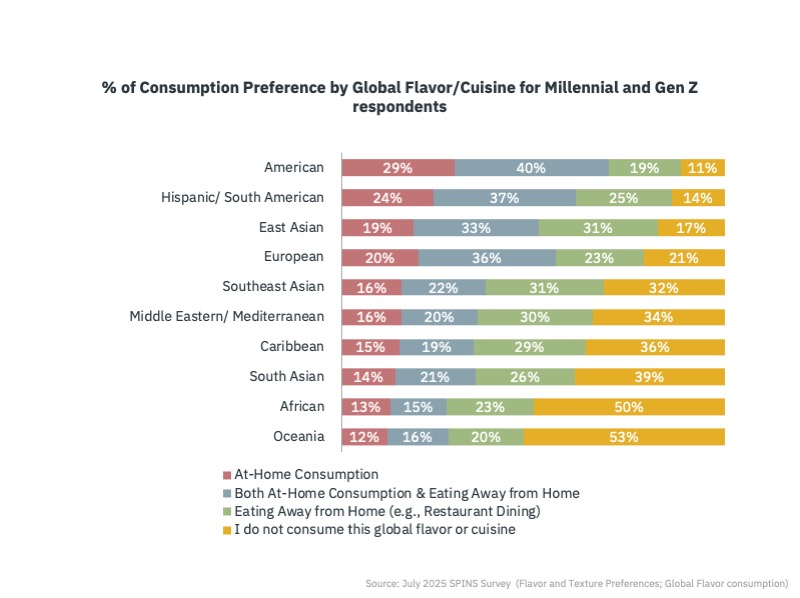
Global cuisines are moving from special occasions into everyday eating. While familiar flavors like American and Hispanic foods remain household staples, cuisines such as Southeast Asian, Middle Eastern, and African are largely experienced away from home. This gap creates a significant opportunity: bringing globally inspired flavors into everyday meals.
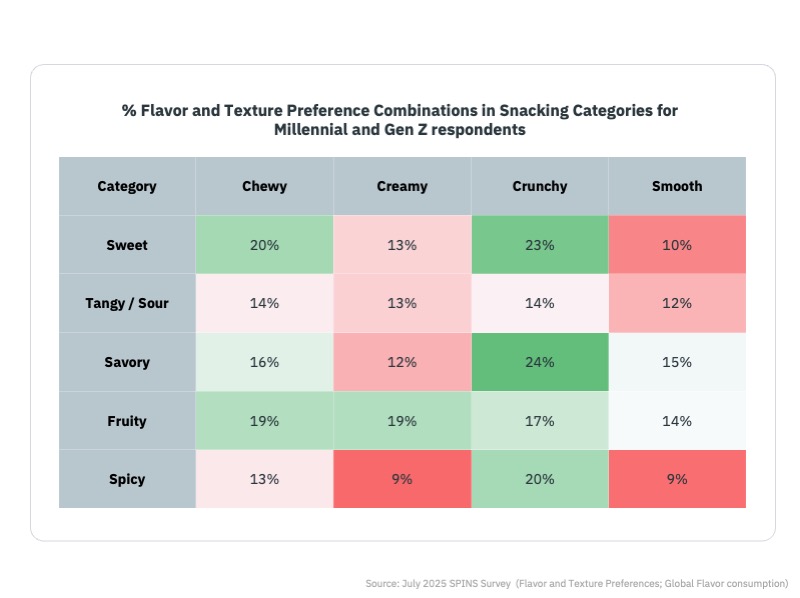
Snacking is leading the way. With its low-risk, high-reward nature, snacking allows consumers to explore chewy, fruity, crunchy, and spicy combinations without overhauling their meal routines. These formats provide a launchpad for global-inspired experimentation, turning the snack aisle into an innovation playground.
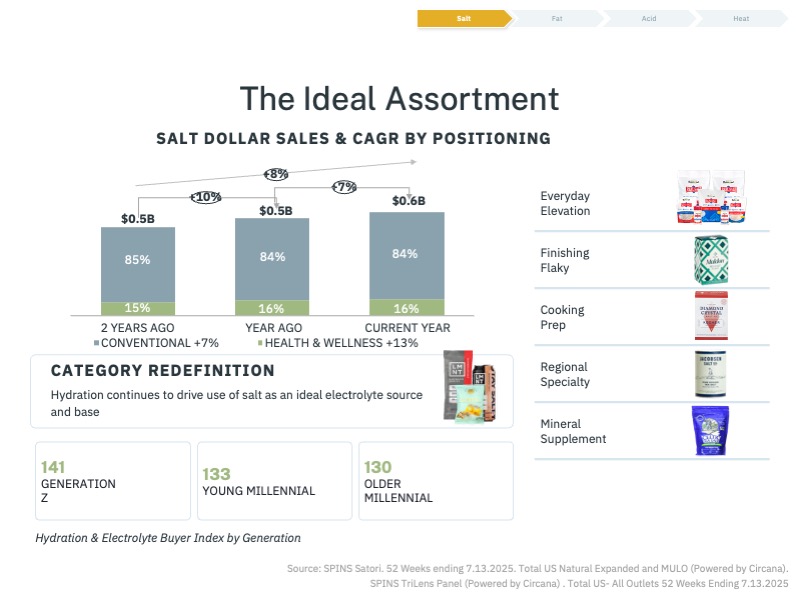
Salt: From Seasoning to Functional Wellness
Salt is being reframed from a dietary villain into a functional wellness tool. Younger consumers are driving demand for mineral-rich salts and hydration packets, seeking clean electrolytes and enhanced flavor.
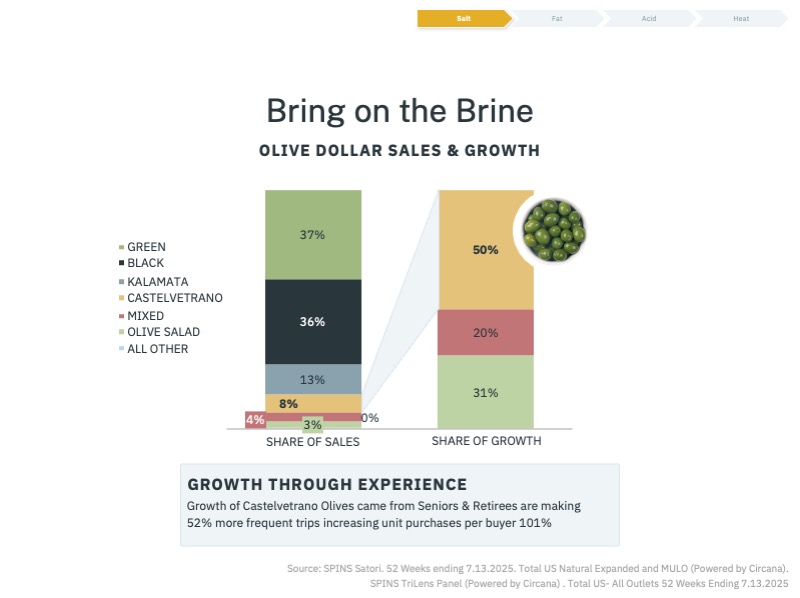
Meanwhile, older generations are upgrading to premium pantry staples such as olives, contributing nearly half of the category’s growth.
This dual shift highlights salt’s expanding role: it can be indulgent and functional, a flavor enhancer and a wellness driver. For brands, salt is no longer a commodity; it’s a platform for innovation.
Fat: Broadened Cooking Mediums and Bases
The “low-fat” era has given way to “smart fats.” Consumers now see fats as tools for satiety, flavor, and fitness rather than as nutrients to avoid. Avocado, coconut, and premium olive oils are becoming kitchen mainstays, while ghee and beef tallow are finding favor for their rich flavors and high smoke points.
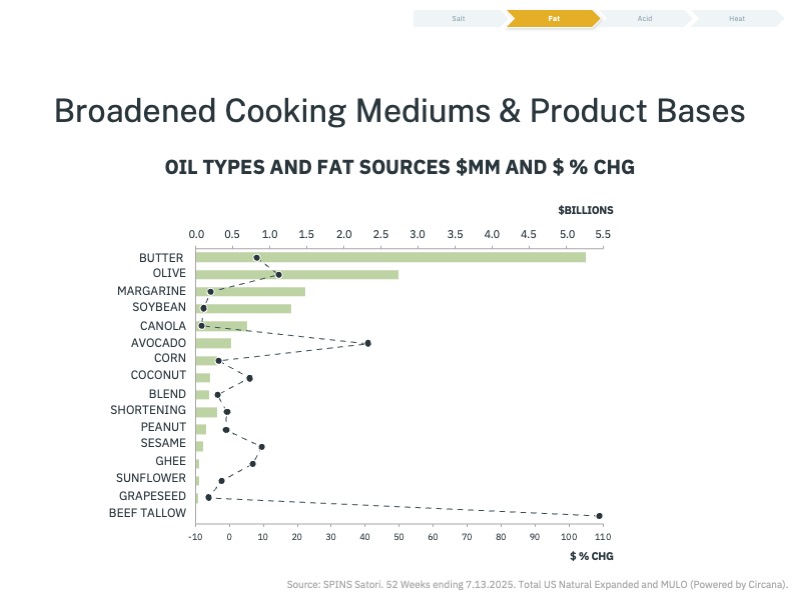
As Millennials and multi-person households trade up in their oil and fat selections, brands that highlight the culinary and nutritional benefits of fats can meet this renewed demand head-on.
Dairy Reclaims Nutritional Value
Once demonized, dairy is reclaiming its place as a nutritional cornerstone. Ultrafiltered and A2 milks are growing in double digits, while cottage cheese has surged in popularity with a five-point increase in household penetration over three years.
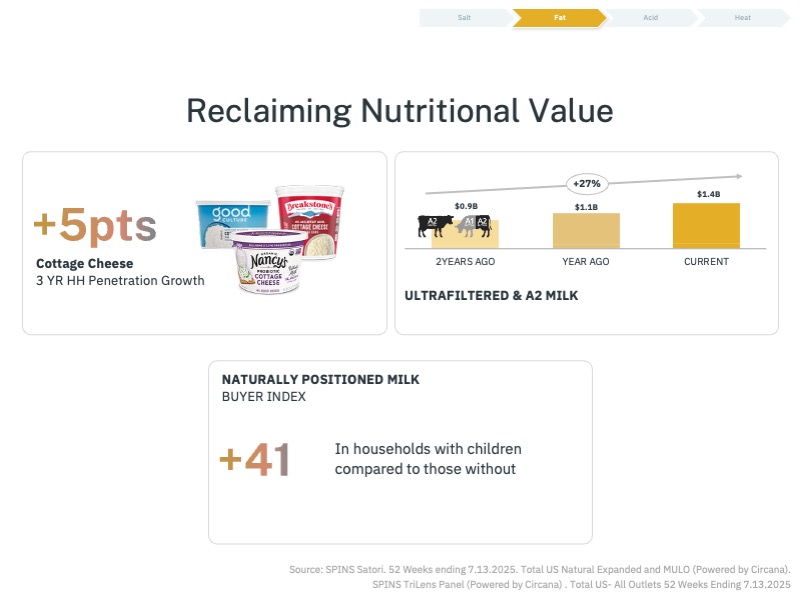
The inherent protein value of dairy is reframing it as a clean-label, nutrient-rich option rather than a guilty pleasure. Parents, in particular, are prioritizing naturally positioned milk for their children, underscoring the importance of transparency and quality in the dairy aisle.
Acid: Brightness and Fermentation Go Mainstream
Acidic flavors are expanding their reach into new culinary occasions, from sourdough bread to pickles, offering both tangy flavor and digestive health benefits. Fermentation has become synonymous with gut health, aligning with the food-first mindset of Millennials and Gen Z.
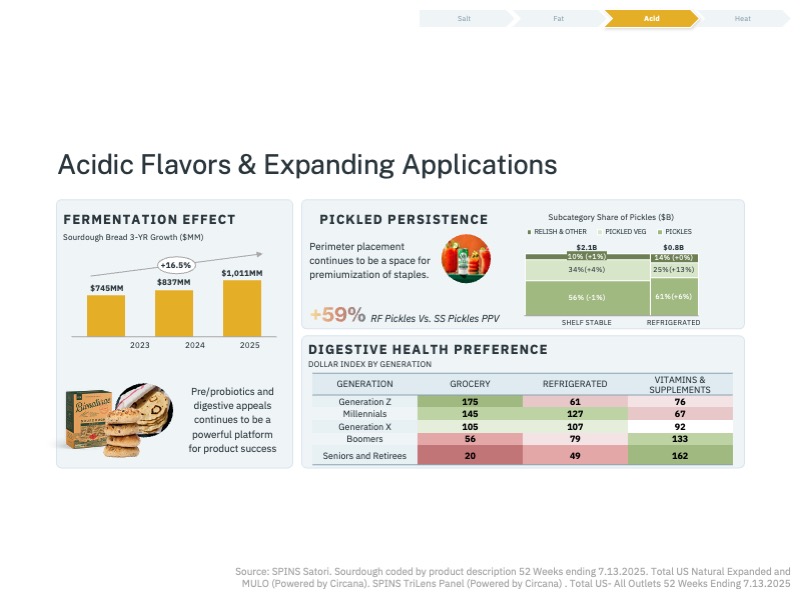
Refrigerated pickles exemplify this trend: not only are they seen as fresher and more premium, but they also command a 59% higher price point than shelf-stable versions. While younger shoppers lean into fermented foods, older generations still prefer probiotic supplements—showing how health goals manifest differently across age groups.
Heat: Mainstreaming the Next Wave
Spice is no longer a niche preference but more of a cultural engine. Globally inspired formats like gochujang, sambal, and chili crisp are moving from specialty shelves into mainstream baskets. Millennials and Gen Z are driving this shift, seeking bold, sensory food experiences.
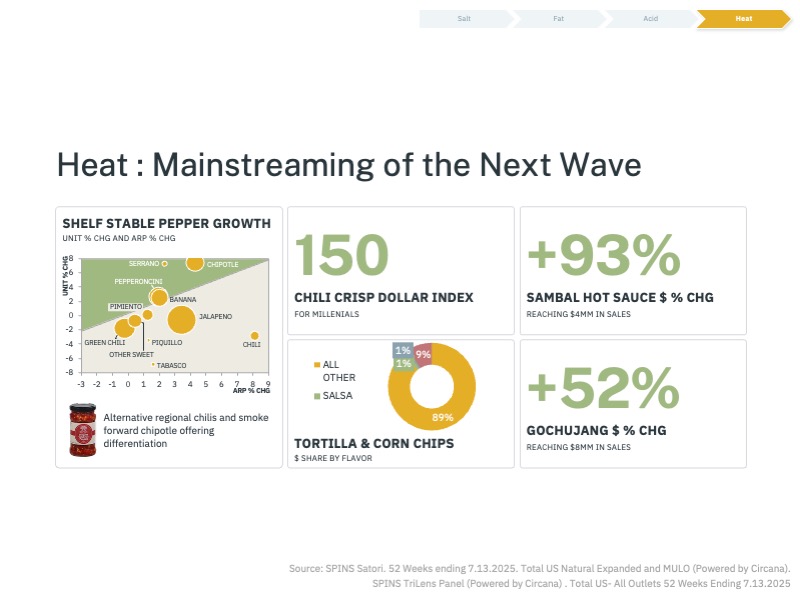
What’s notable is not just the rise of spice, but its frequency. Heat is showing up across snacks, sauces, and frozen meals, enabling brands to integrate global influences into approachable formats. Chili crisp, in particular, has expanded beyond traditional use to become a pantry staple, reflecting consumers’ appetite for adventurous yet convenient flavor experiences.
The Path Forward for Brands and Retailers
The rise of Millennials and Gen Z signals more than just a generational handoff; it’s a fundamental shift in how consumers define health, value, and experience. Their choices reveal a marketplace that prizes transparency, nutrient density, and personalization, all while embracing cultural diversity and adventurous flavor.
For brands and retailers, the path forward is clear: evolve beyond traditional playbooks. Success will come to those who fuse global inspiration with everyday accessibility, balance indulgence with functionality, and meet consumers where discovery truly happens, whether that’s in-store, online, or through AI-driven personalization.
This is not a passing trend; it’s the future of consumption. Those who adapt to the intentional, informed, and exploratory mindset of the next generation will earn more than just a transaction, they’ll secure lasting trust and long-term growth.