Snacking remains popular with consumers – in fact, 73% of Americans snack at least once a day. In terms of snacking, rather than pure impulse or intention, many consumers sit in the middle, and brands are trying to meet the customer wherever they are on their snacking journey. Read our latest ebook to find out how the snack category is evolving, how consumers are gravitating towards fresh snacking and better-for-you snacks & how flavor and texture are driving innovation.
IN THIS REPORT, YOU’LL LEARN ABOUT:
- How consumers are gravitating towards the idea of fresh snacking
- How flavor and textures are driving innovation in the snacks category
- What functional ingredients and nutrients are driving growth in the snacks category
The Evolution of Snacking: From Impulse to Intention
Snacking has historically lived at the intersection of convenience and indulgence—a bag of chips grabbed at checkout, or a mid-afternoon cookie to satisfy a craving. But today’s consumers are becoming more mindful of what they reach for between meals. In fact, many now view snacks as mini-meals that support their broader wellness goals.
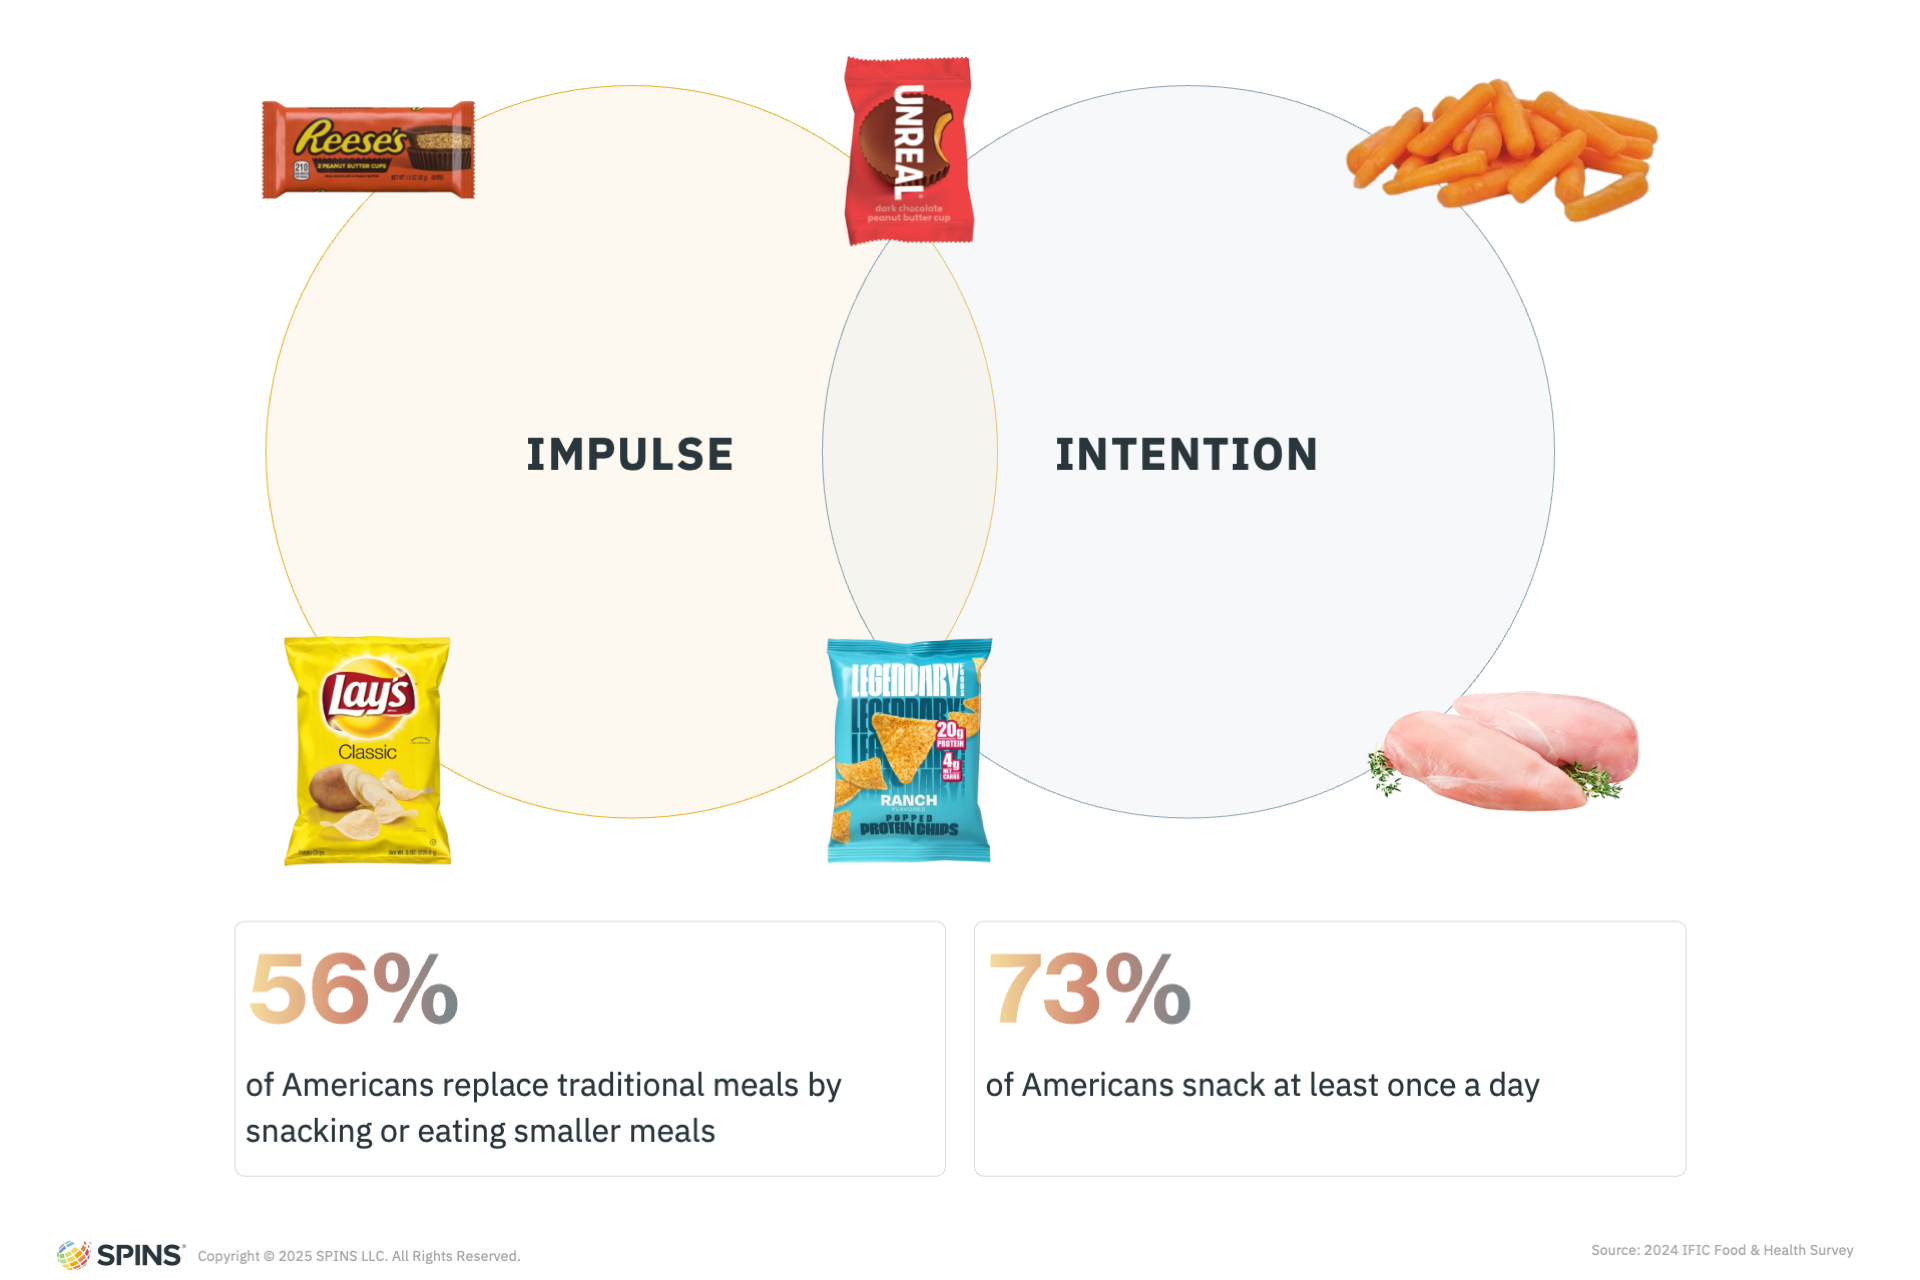
The statistics speak volumes:
- 56% of Americans now replace traditional meals with snacks or smaller meals.
- 73% of Americans snack at least once a day.
These figures reflect not just frequency, but a redefinition of snacking itself. Today’s snackers might reach for conventional treats—or they might opt for baby carrots, protein-packed yogurt, or globally inspired refrigerated bites. Many consumers land somewhere in between, showing that the intent behind snacking is fluid and contextual.
Yogurt’s Rise: A Signal of Functional Snacking
To better understand these shifts, SPINS’ Eating Occasion attribute offers a lens into how consumers approach different food types based on when and how they’re consumed. This attribute maps products to primary eating occasions—such as breakfast, dessert, or snacking—by evaluating product type, category, and label claims.
Looking across 29 categories, 68 subcategories, and 480 product types, total snacking reached $127 billion over the past year. While the overall category saw modest dollar growth of 0.3%, yogurt stood out as a category redefining modern snacking.
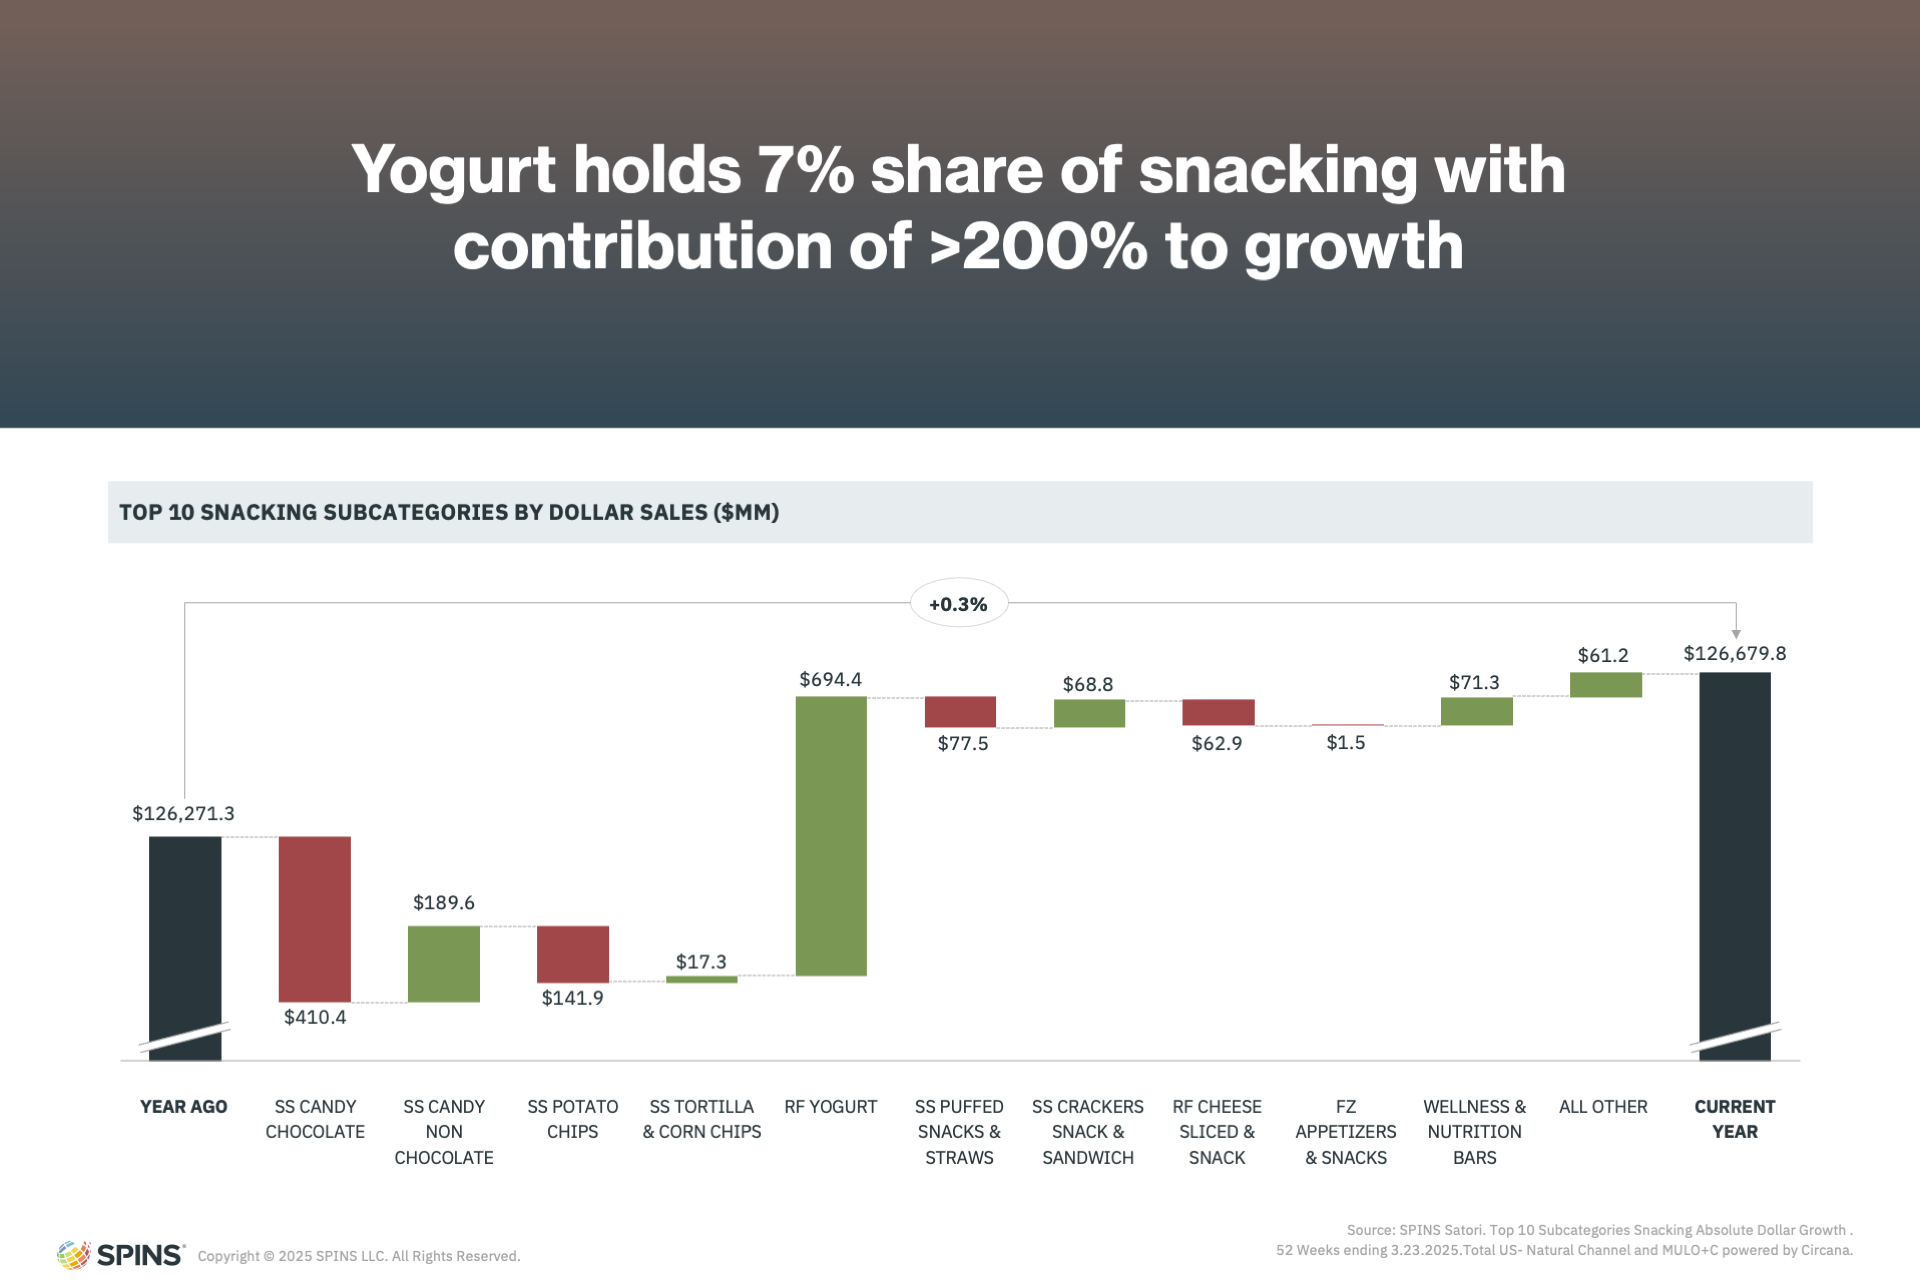
With over $694 million in absolute dollar growth, yogurt contributed more than 200% of total growth, compensating for declines in categories like chocolate and potato chips. Its performance indicates a major shift: yogurt is no longer confined to breakfast. It’s now a go-to, high-protein snack option that offers both nutrition and convenience—hallmarks of the new intentional snacking mindset.
The Natural Channel Leads the Way
The rise of intentional snacking is also closely tied to the growth of the natural products channel, which is outperforming the rest of the market in 70% of the fastest-growing snacking subcategories.
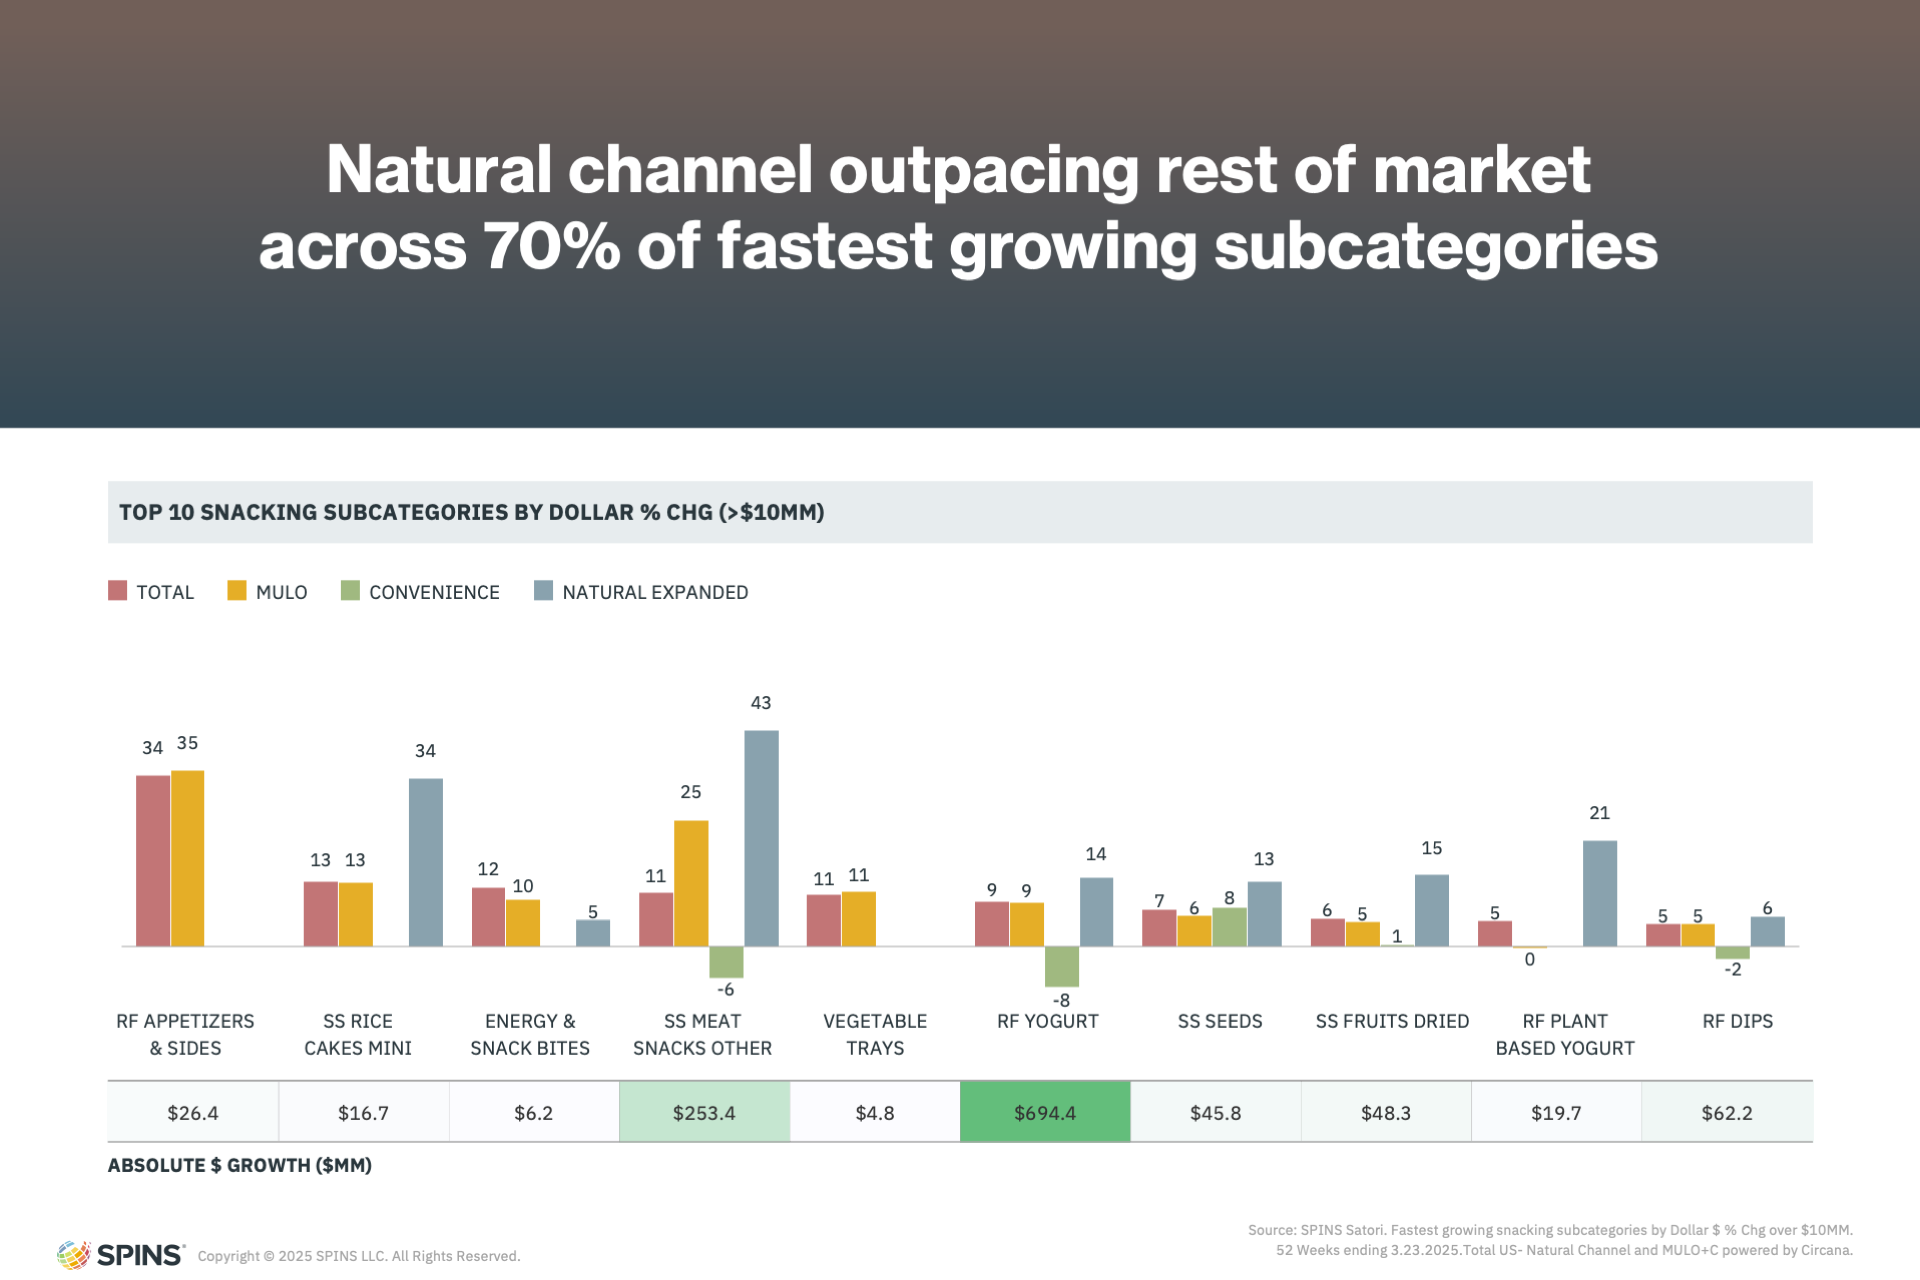
Examples of these subcategories include:
- Meat snacks and yogurts, offering protein and satiety
- Seeds, blending portability with nutrition
- Rice cakes, now reimagined with indulgent flavors in bite-sized formats
- Refrigerated appetizers, the fastest-growing subcategory, catering to consumers’ interest in multicultural flavors and convenience, think spring rolls and dumplings becoming more mainstream
These examples illustrate that today’s consumers are seeking snacks that not only taste good but also deliver a purpose—be it added protein, lower calories, or unique flavor experiences.
Redefining the Snacking Landscape
Visualizing the snacking landscape through data reveals how natural products are not just participating—they’re leading category evolution. When charting growth against the natural channel’s share of category sales, clear patterns emerge: categories with high growth and a strong natural product presence are reshaping the very definition of snacking.
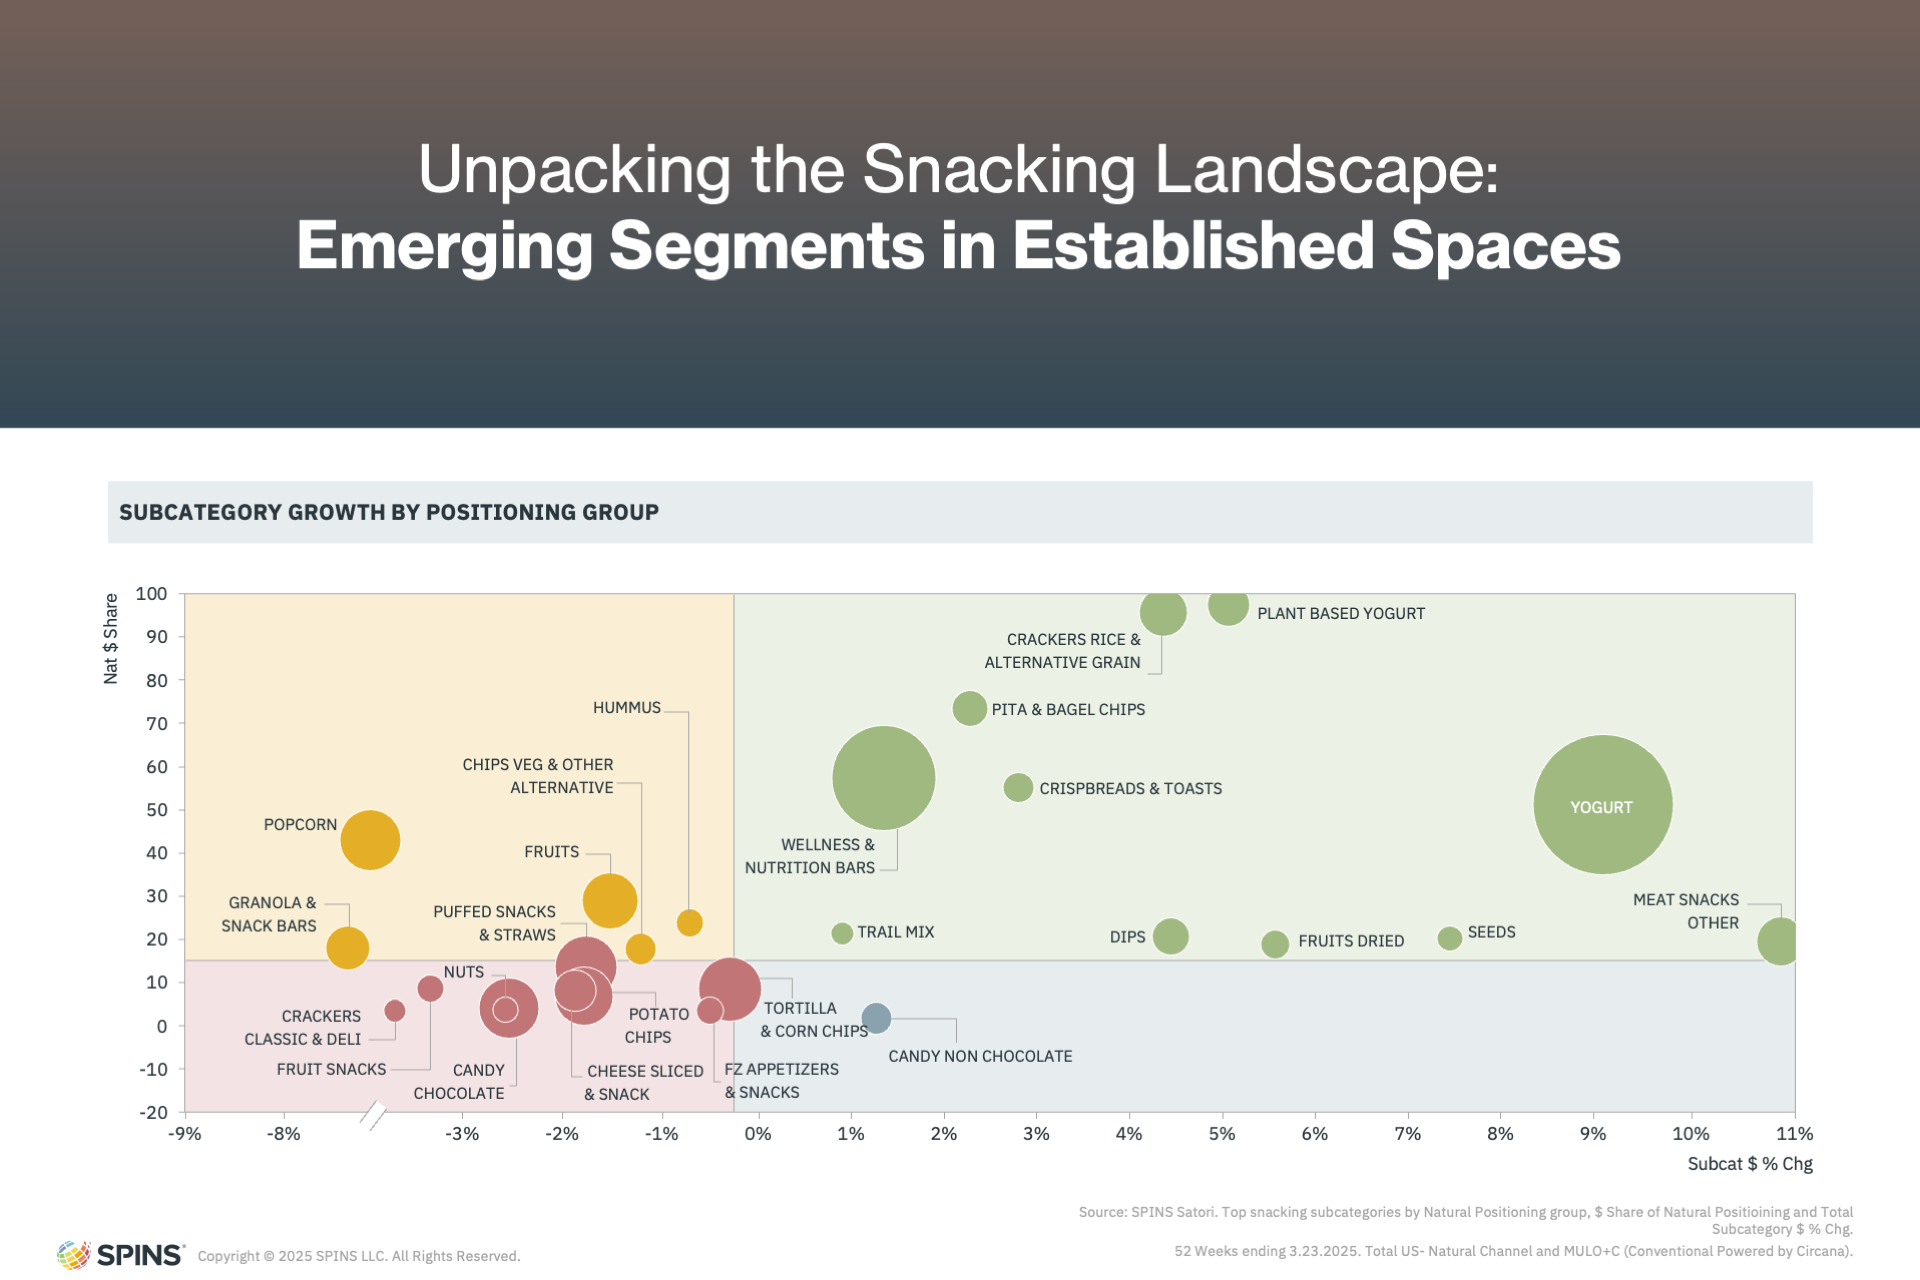
Yogurt continues to be a flagship example of this movement. It represents how fresh, functional, and intentional snacking is redefining consumer habits and challenging what a “snack” looks like. The trend suggests that more subcategories may follow this path, blending health-forward innovation with convenience to meet evolving consumer expectations.
Refrigerated Revival: How Fresh Snacking Is Redefining Convenience
As consumers become more intentional about their snacking habits, they’re not just reading labels—they’re rethinking what a snack can be altogether. One of the most dynamic shifts in the category is the surge in fresh snacking, where traditional refrigerated items are reimagined with modern health cues and functional benefits. This trend doesn’t just reflect changing tastes—it’s a return to basics, updated for today’s busy, health-conscious lifestyles.
Fresh Snacking: Back to Basics
Today’s snackers are creative, selective, and motivated by more than just convenience—they want quality, freshness, and functionality. The refrigerated aisle is seeing renewed energy, with a clear movement toward fresh snacks that feel simple, wholesome, and revitalized.
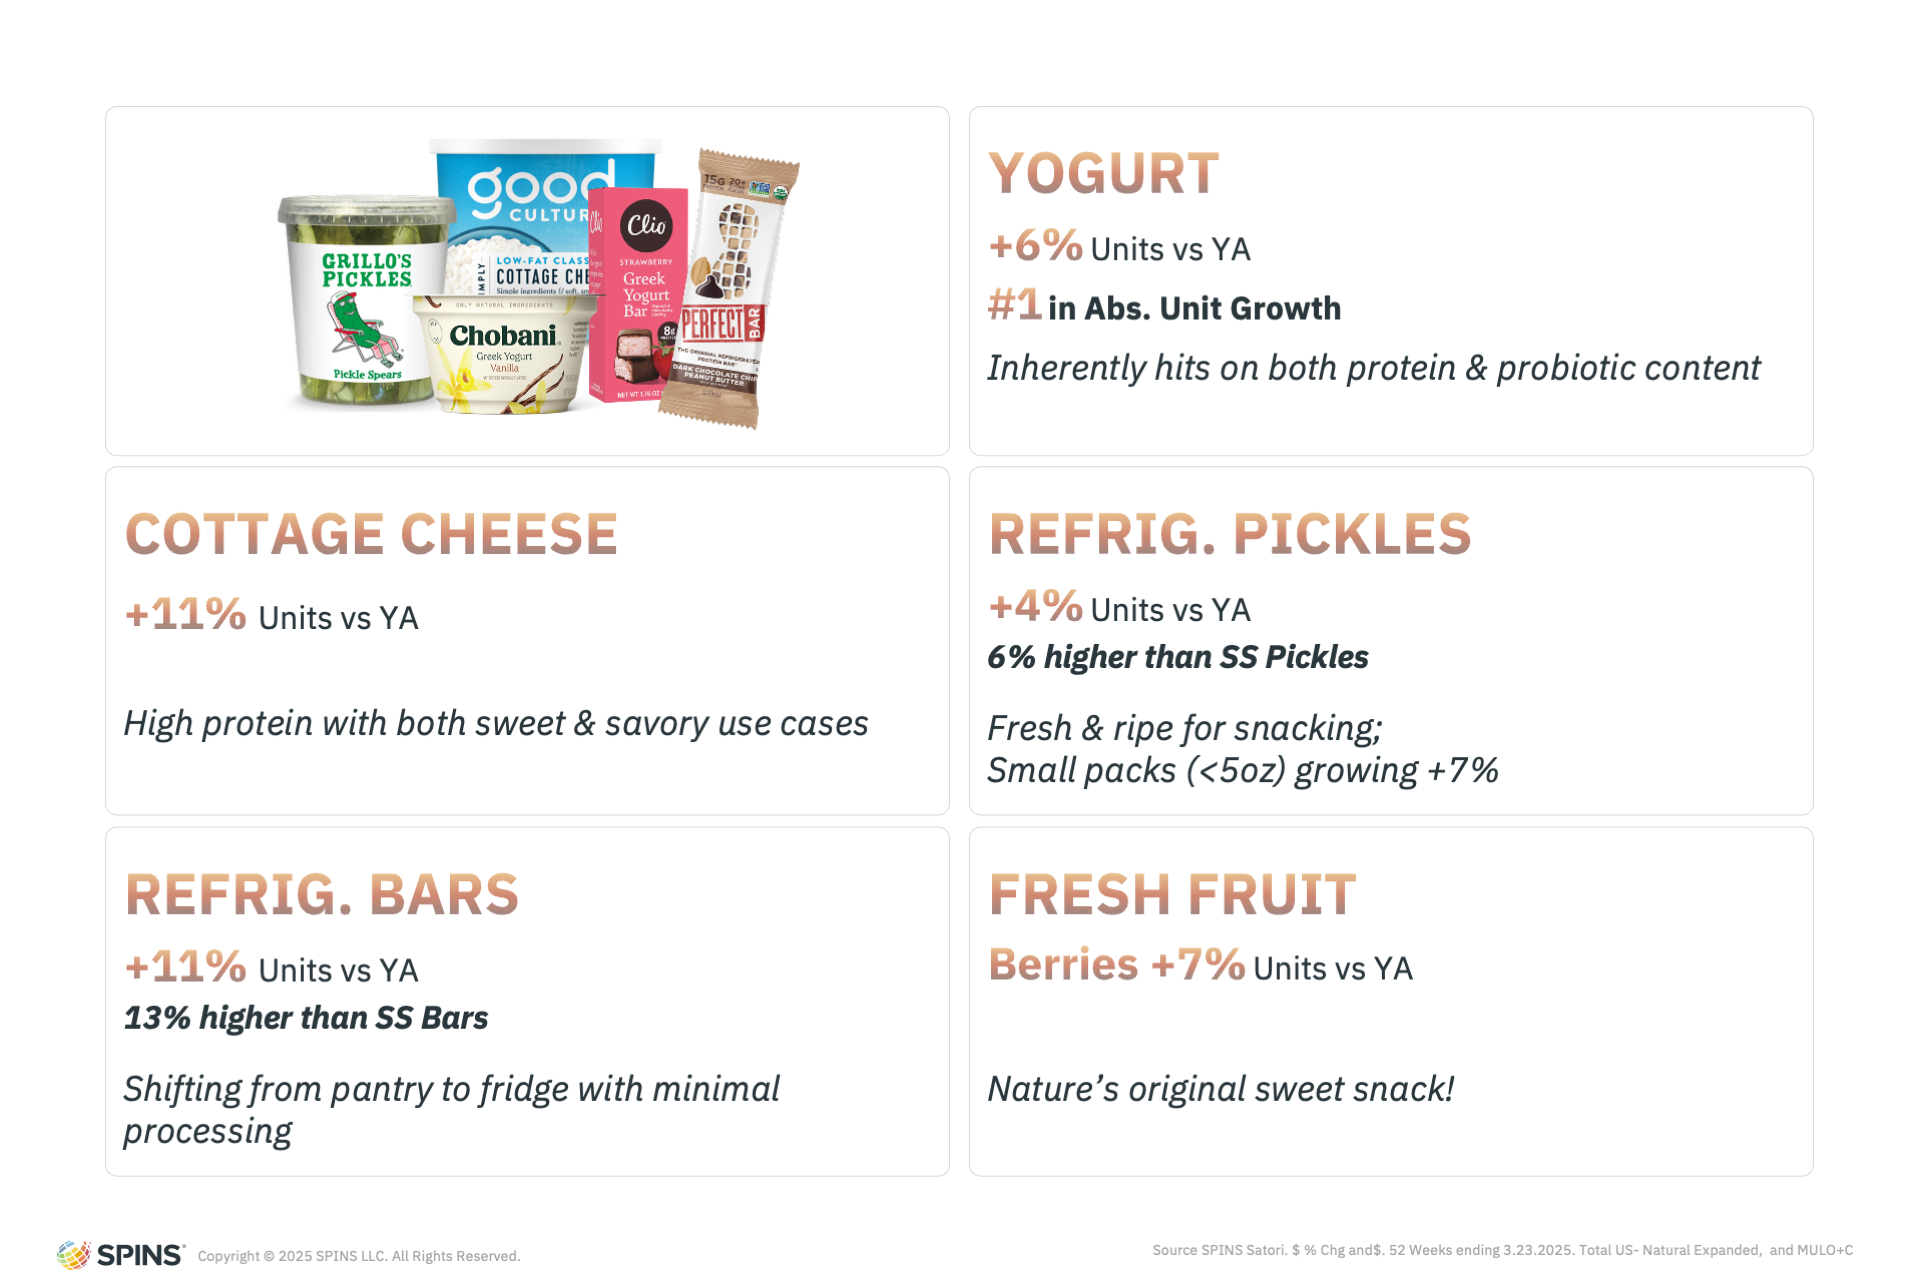
Yogurt continues to dominate, leading absolute unit growth across the refrigerated section. Its versatility—across dayparts and formats—makes it a staple that checks all the boxes: high in protein, good for gut health, and inherently snackable.
Cottage cheese is another standout. Once an overlooked option, it’s now finding new life thanks to its high-protein, low-carb profile and adaptability across sweet and savory applications. These classic staples have been reimagined to meet modern expectations.
Other surprising players in the refrigerated snacking boom?
- Pickles, which have moved from pantry staples to chilled, snackable single-serve containers or ones that tout probiotics as well
- Nutrition bars, where shelf-stable varieties are declining while refrigerated versions, with cleaner ingredients, are gaining traction
- And, of course, fresh fruit, the original sweet snack, with products like berries leading the charge in strong unit growth
Fresh Future: Cleaning Up the Fridge
This return to basics also means cleaning up what’s long been in the fridge. Many legacy refrigerated snacks are losing favor to better-for-you versions that reflect consumers’ growing desire for transparency, taste, and nutrition.
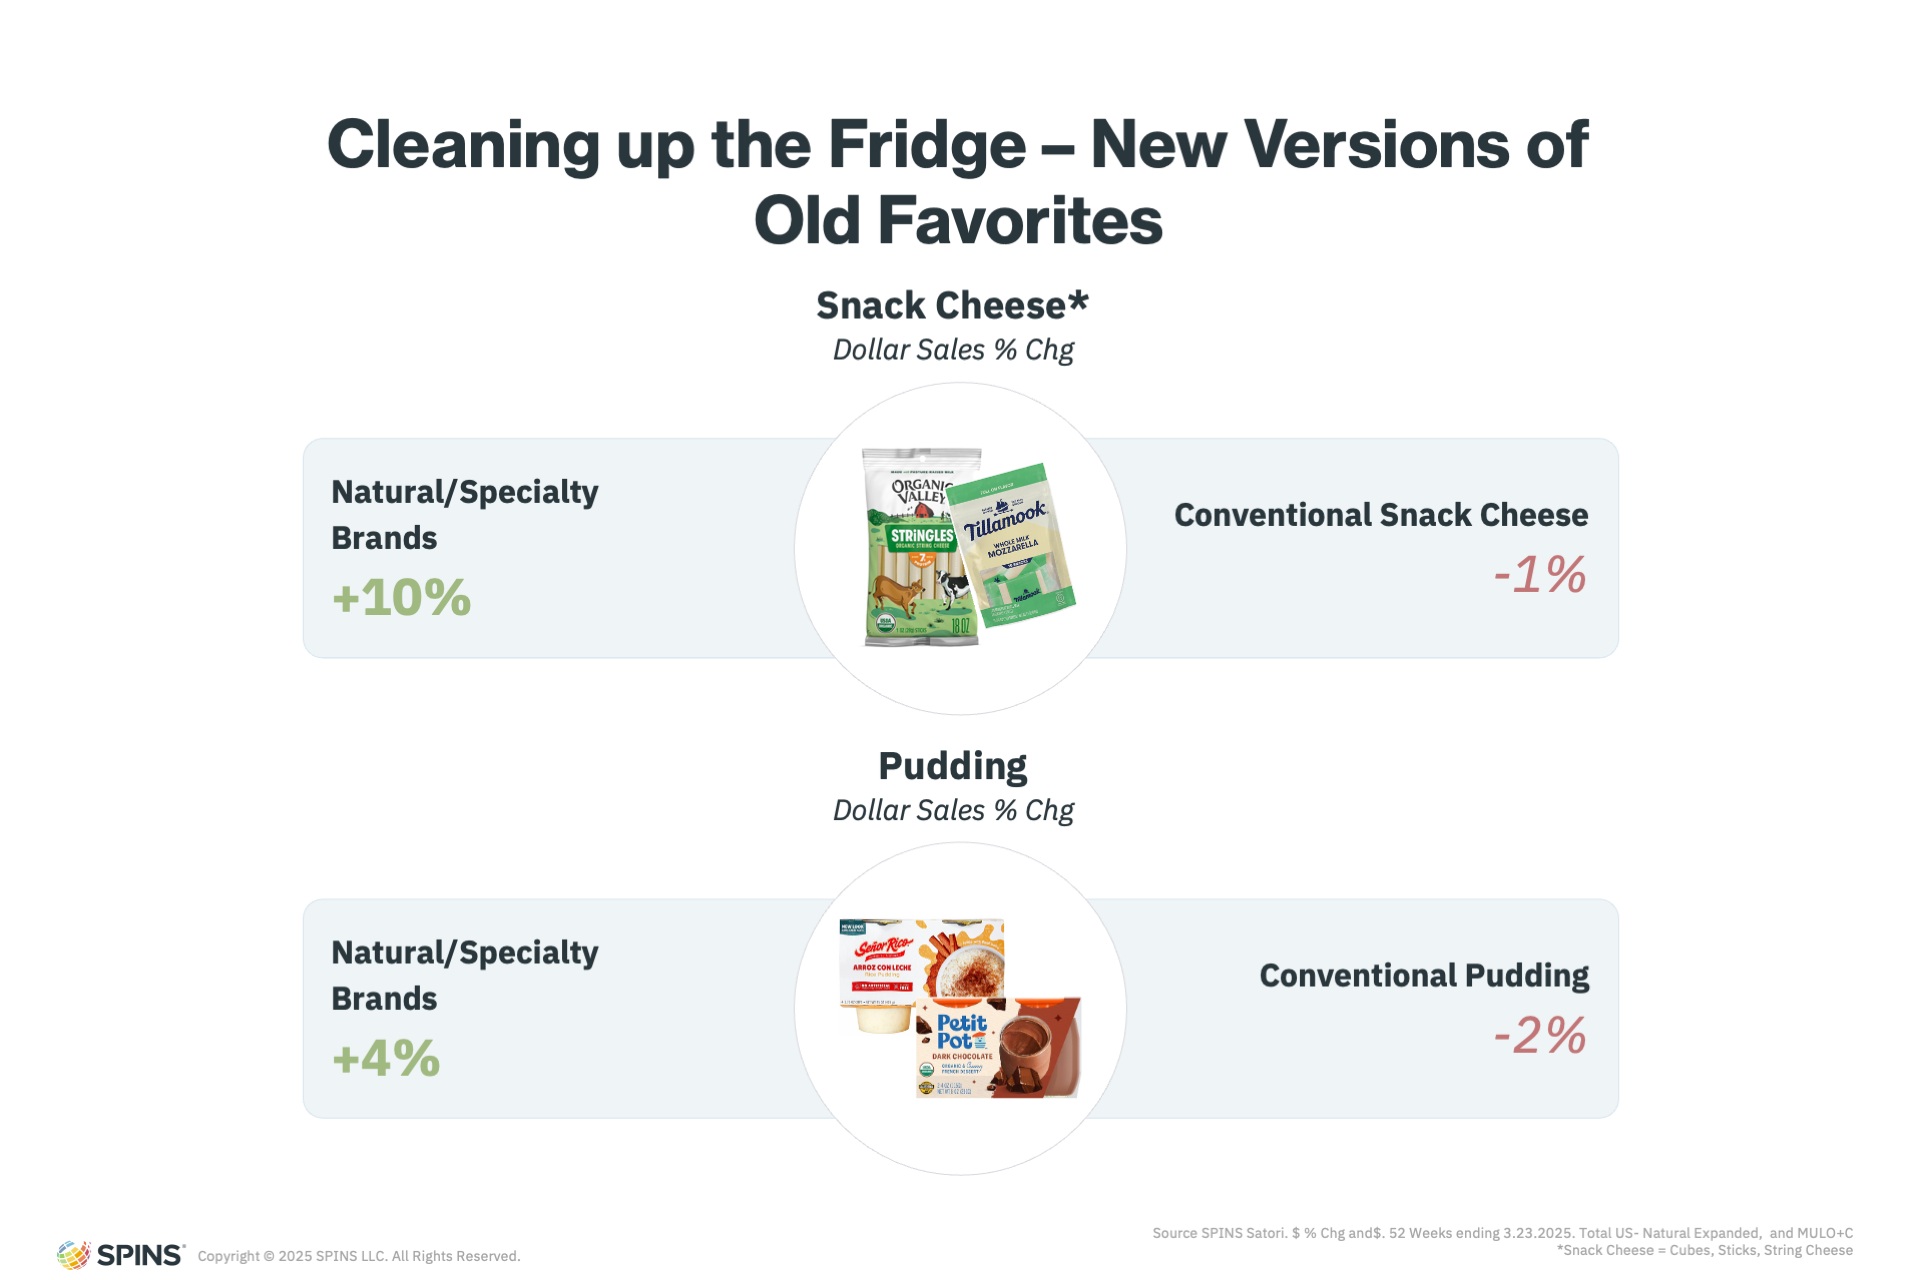
Take snacking cheese, for example. While traditional string cheese and cubes are declining, natural and specialty cheeses from brands like Tillamook and Organic Valley are growing in double digits. These products appeal with their simple ingredients, rich flavors, and premium feel.
A similar pattern is emerging in pudding. Conventional options are flat or declining, while natural alternatives are rising. Brands like Señor Rico and Petit Pot are capturing attention with more authentic, clean-label offerings—often in sustainable packaging like glass jars—demonstrating that indulgent snacks can also be fresh and mindful.
Blurring Boundaries: Breakfast, Snacks, and Kids
The future of fresh snacking isn’t just about better ingredients—it’s also about new formats and occasions. One clear signal is the rise of products that blur the line between breakfast and snacks, creating entirely new use cases for refrigerated foods.
- Ready-to-eat oat cups are up 23% year-over-year, carving a path between traditional morning meals and anytime snacking
- Egg bites, mini pancakes, and refrigerated bars (like those from brands such as Belgian Boys) are reshaping what belongs in the snack set
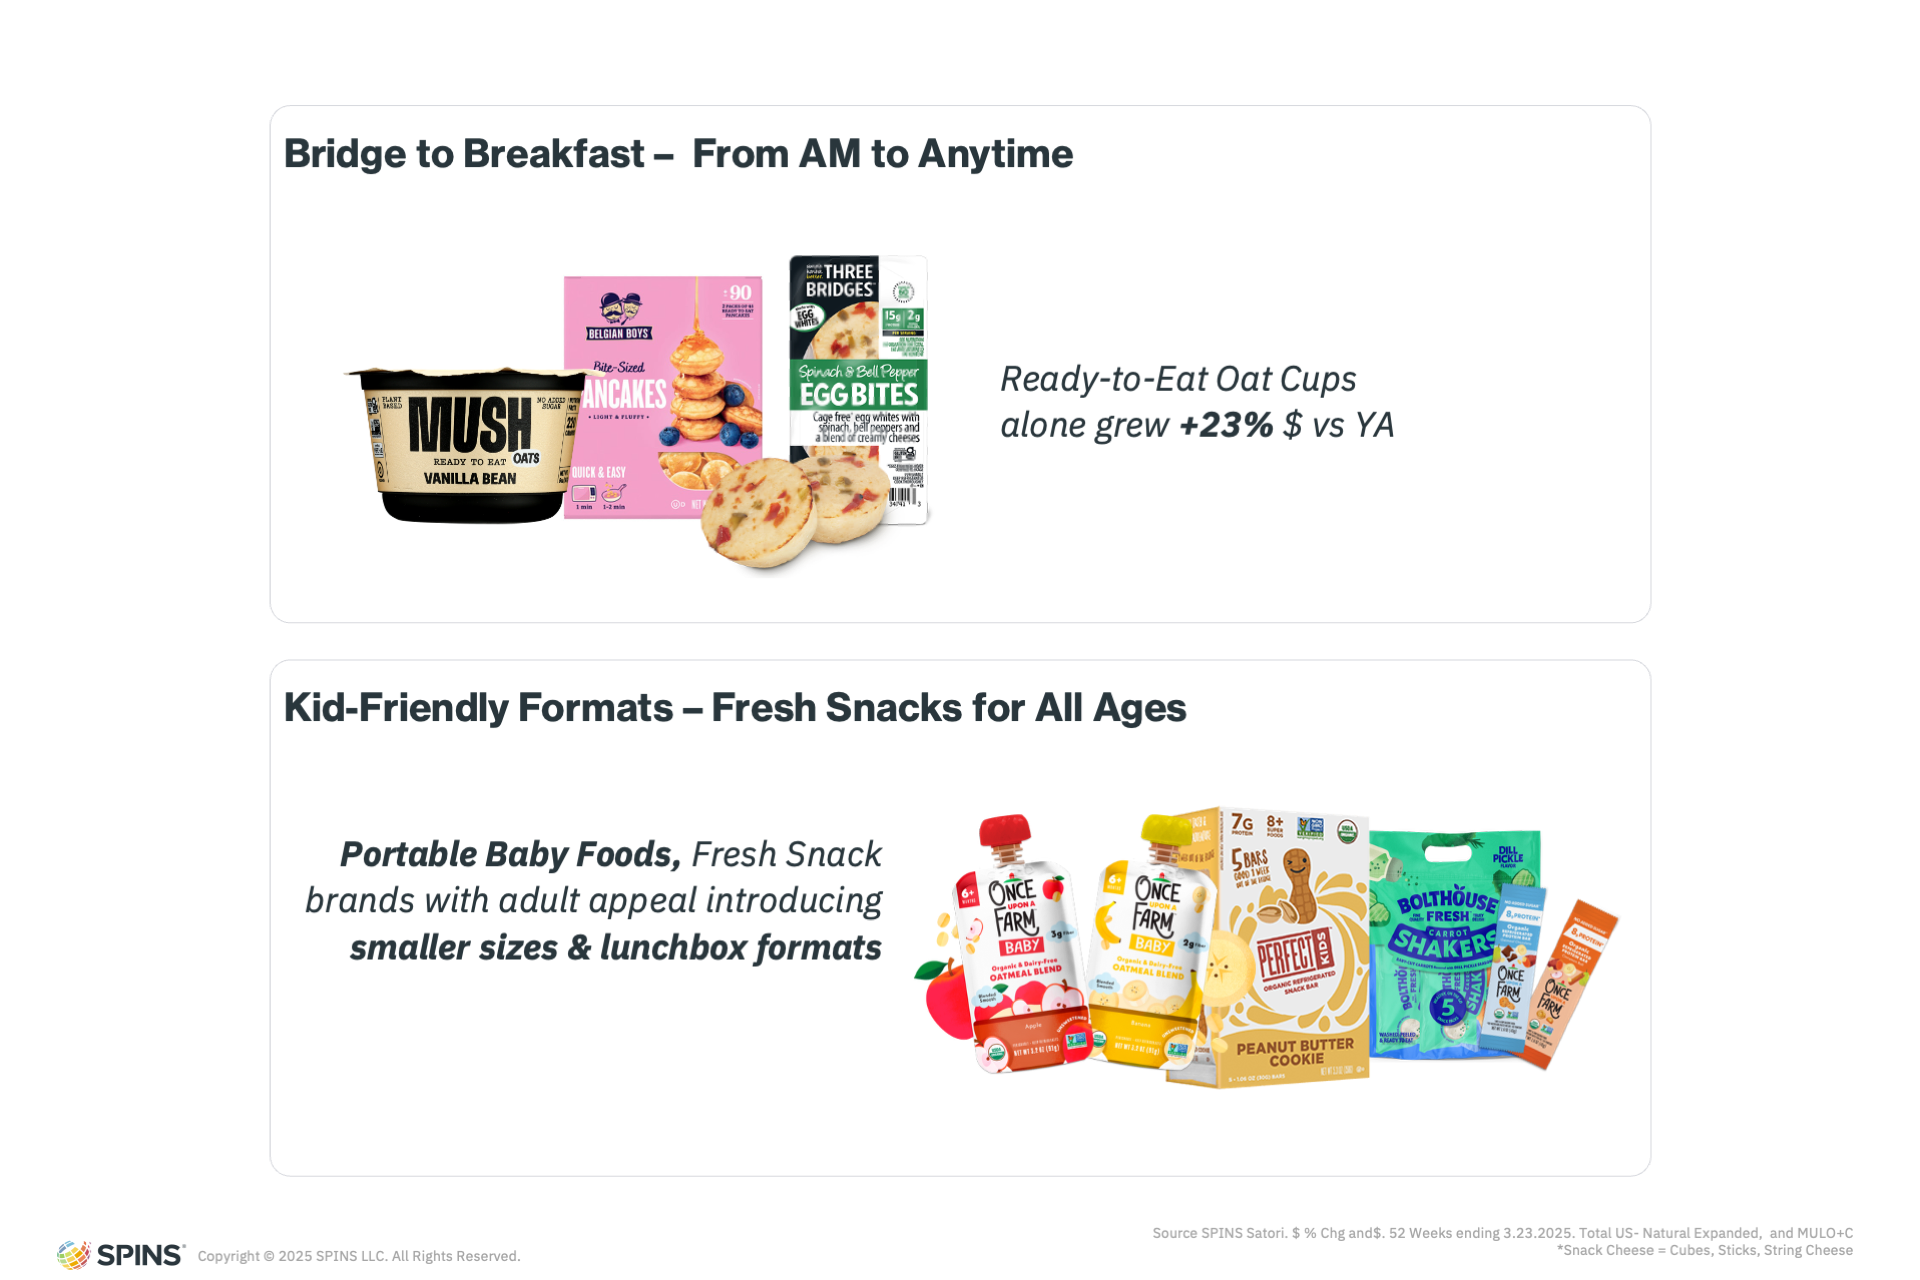
Fresh snacking is also expanding into kid-friendly formats, with parents seeking healthy options that are just as convenient as they are fun.
- Once Upon a Farm helped popularize refrigerated pouches for little ones
- Bolthouse Farms has introduced shakeable, snackable veggies with added seasoning
- Even brands historically geared toward adults—like Mush and Perfect Bar—are launching kid-focused extensions with smaller sizes and more playful packaging
Snacking Gets Sensory: Exploring Flavor and Texture Trends
As snacking continues its evolution from impulse to intention, consumer expectations are extending far beyond health benefits or convenience. Increasingly, shoppers are seeking multisensory experiences—snacks that not only nourish but excite. The next frontier of snack innovation is being shaped by flavor and texture, with brands pushing boundaries, blending categories, and taking cues from global cuisines and culinary traditions.
Flavor Inspiration From Across the Aisle
One of the biggest flavor trends in salty snacks today is cross-category inspiration. Condiments, once confined to the perimeter of the store, are now making their way into chip bags and rice cakes. Hot sauces, pickled vegetables, barbecue sauces, and even dipping condiments have become muses for snack developers.
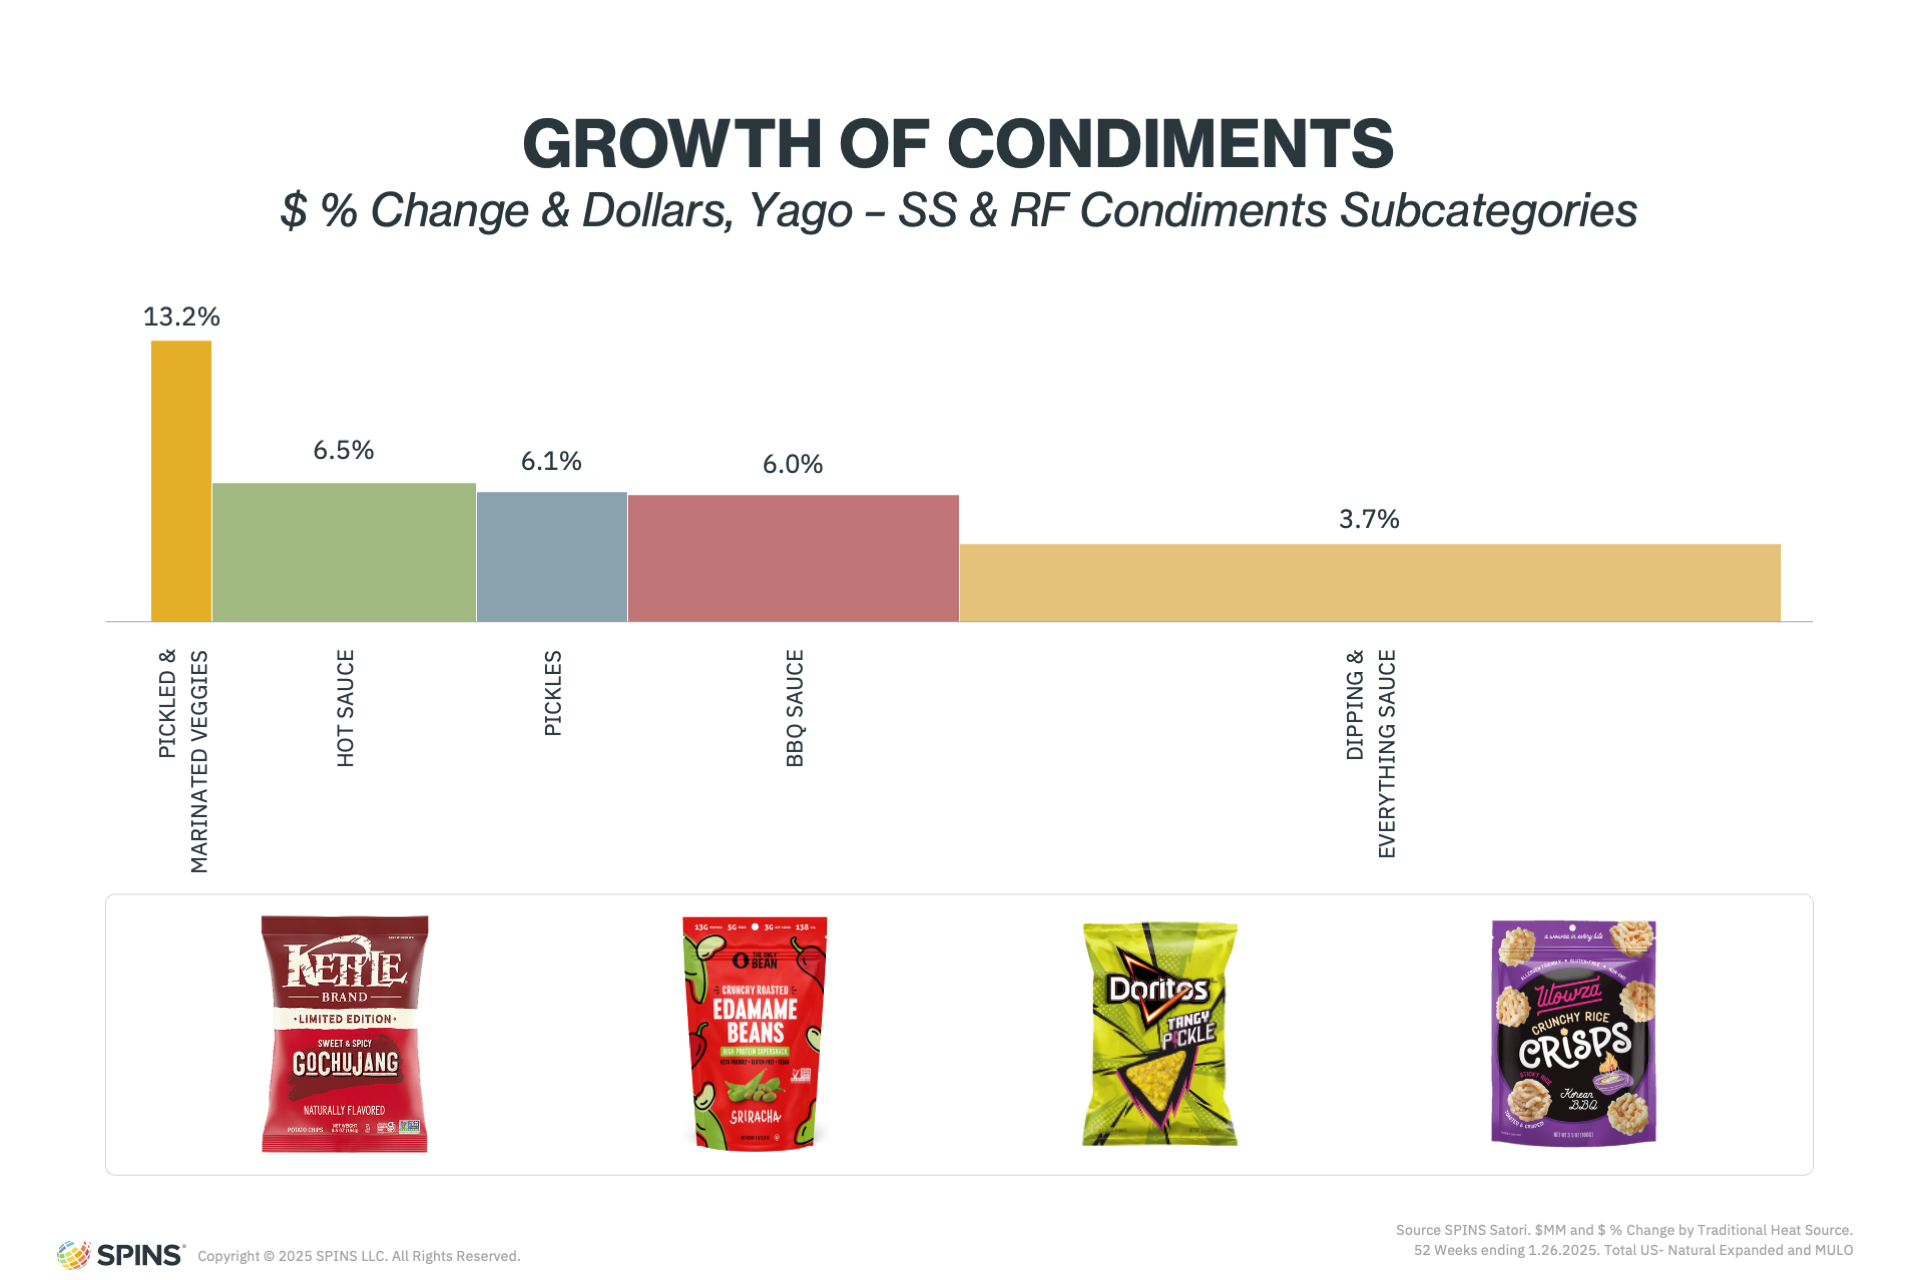
This is more than just a trend—it’s a playbook for flavor-forward innovation. Think gochujang kettle chips, sriracha edamame, tangy pickle-flavored Doritos, and Korean barbecue flavored rice cakes. These product launches are direct reflections of where flavor growth is happening elsewhere in the store. Brands that can translate condiment aisle hits into salty snack formats are winning over consumers who crave bold, globally inspired, and craveable tastes.
International Flavor Fusion
Global flavors have moved from niche appeal to mainstream must-haves. Consumers are hungry for diversity, and international snacks are experiencing strong year-over-year growth. Using our country of origin attribution, we can see products from China, Japan, El Salvador, Turkey, and Iceland all posted more than 20% growth this past year, with Chinese items leading at 33%.
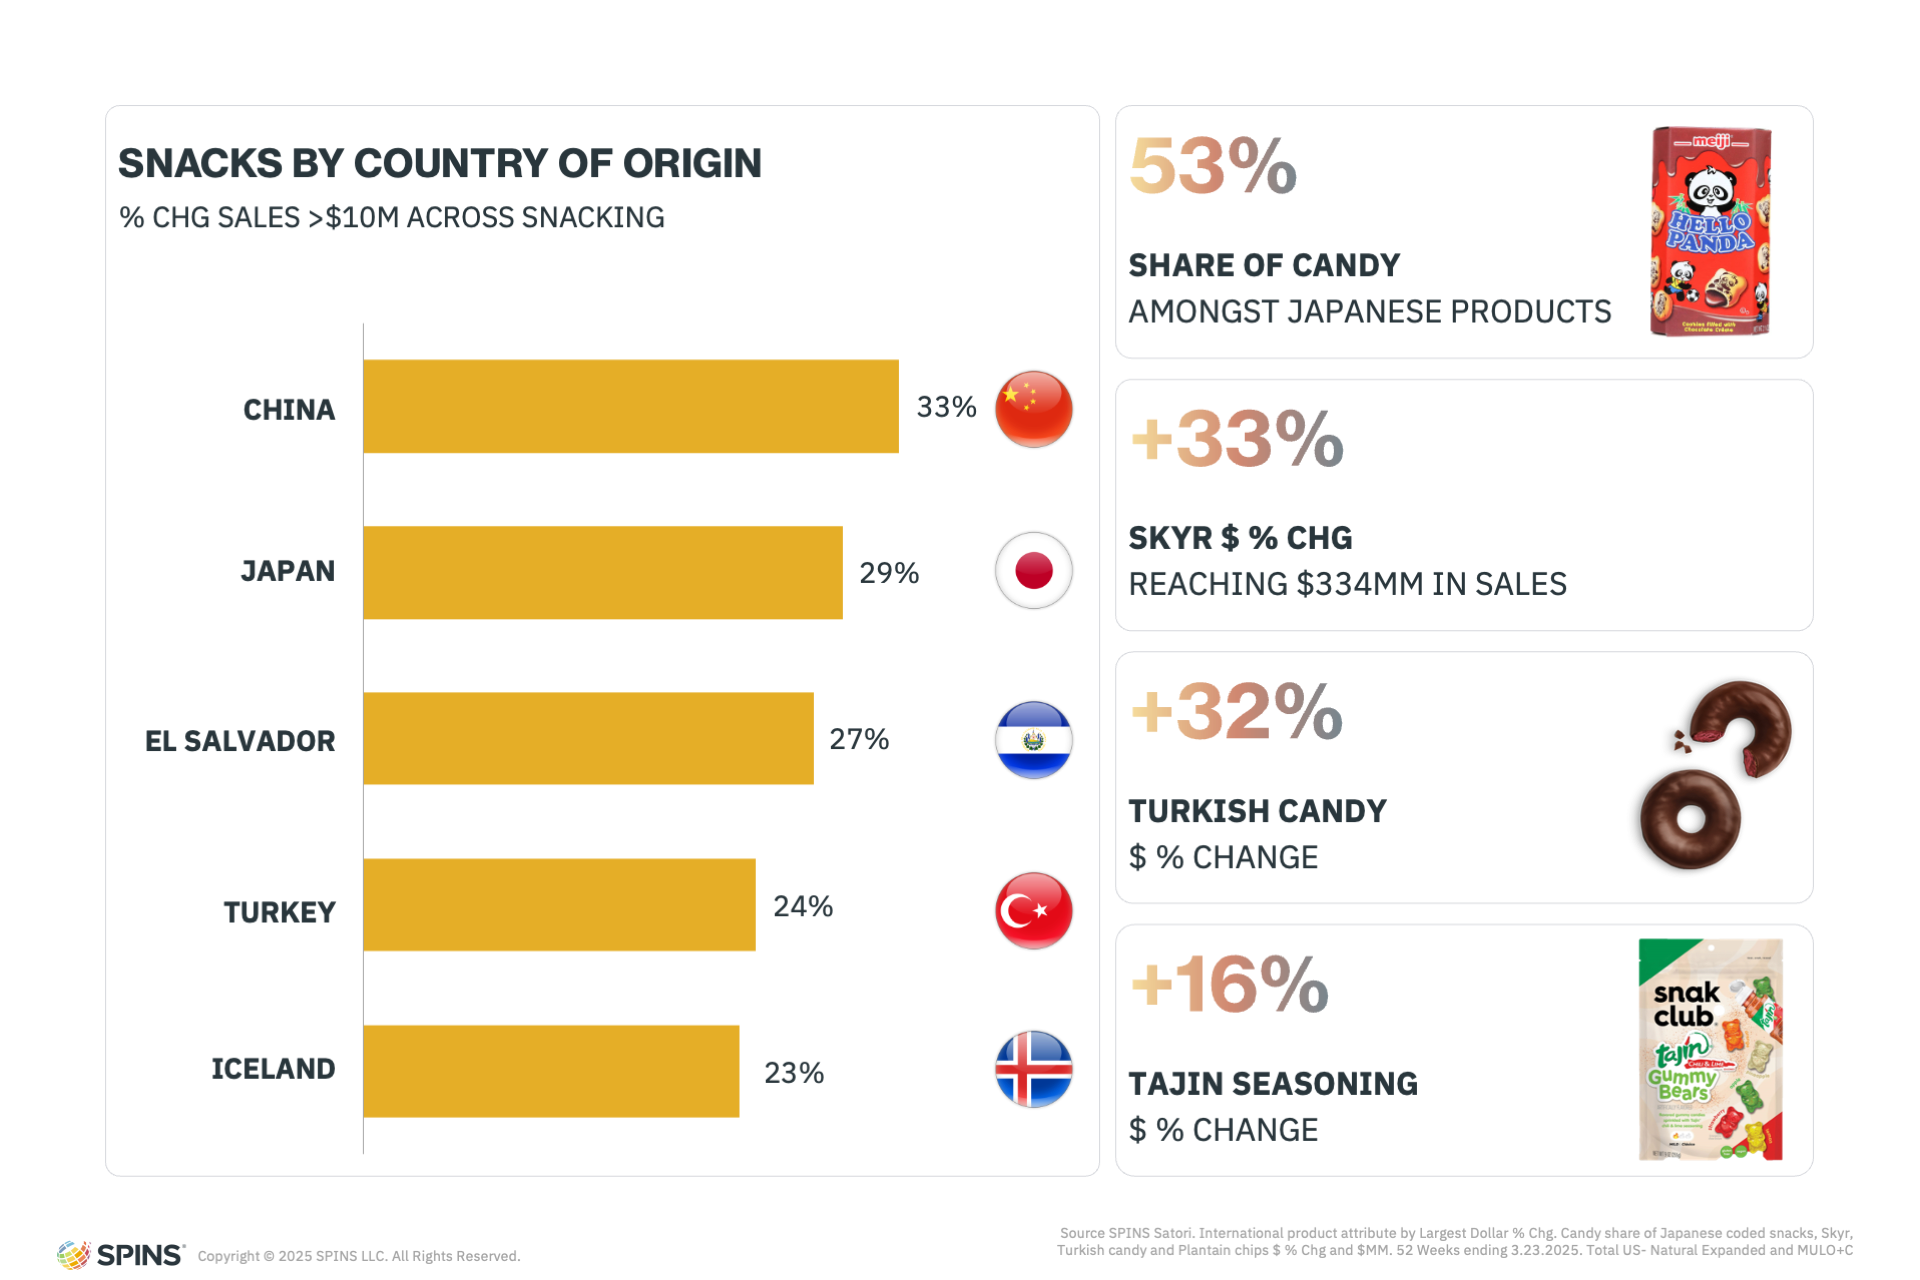
Japan’s influence is particularly strong in candy, where it commands 53% share of the Japanese snacking segment. Turkish halva jelly donuts are helping drive a 32% jump in Turkish candy sales, while Iceland’s Skyr—a lighter, less tangy alternative to Greek yogurt—has grown 33%, reaching $334 million in annual sales.
Perhaps the best example of international fusion is the rise of tajín-flavored gummy bears, which combine candy with spice, sweet with savory, and tradition with innovation. These mashups are signaling a new era of globally influenced snacking that celebrates complexity and cultural storytelling through taste.
Texture Is Complex
While flavor sparks the initial craving, texture keeps consumers engaged. Texture is emerging as a powerful differentiator in snack development, and nowhere is this more evident than in the gummy category. Once limited to classic chewy formats, gummies have evolved into a playground for texture experimentation.
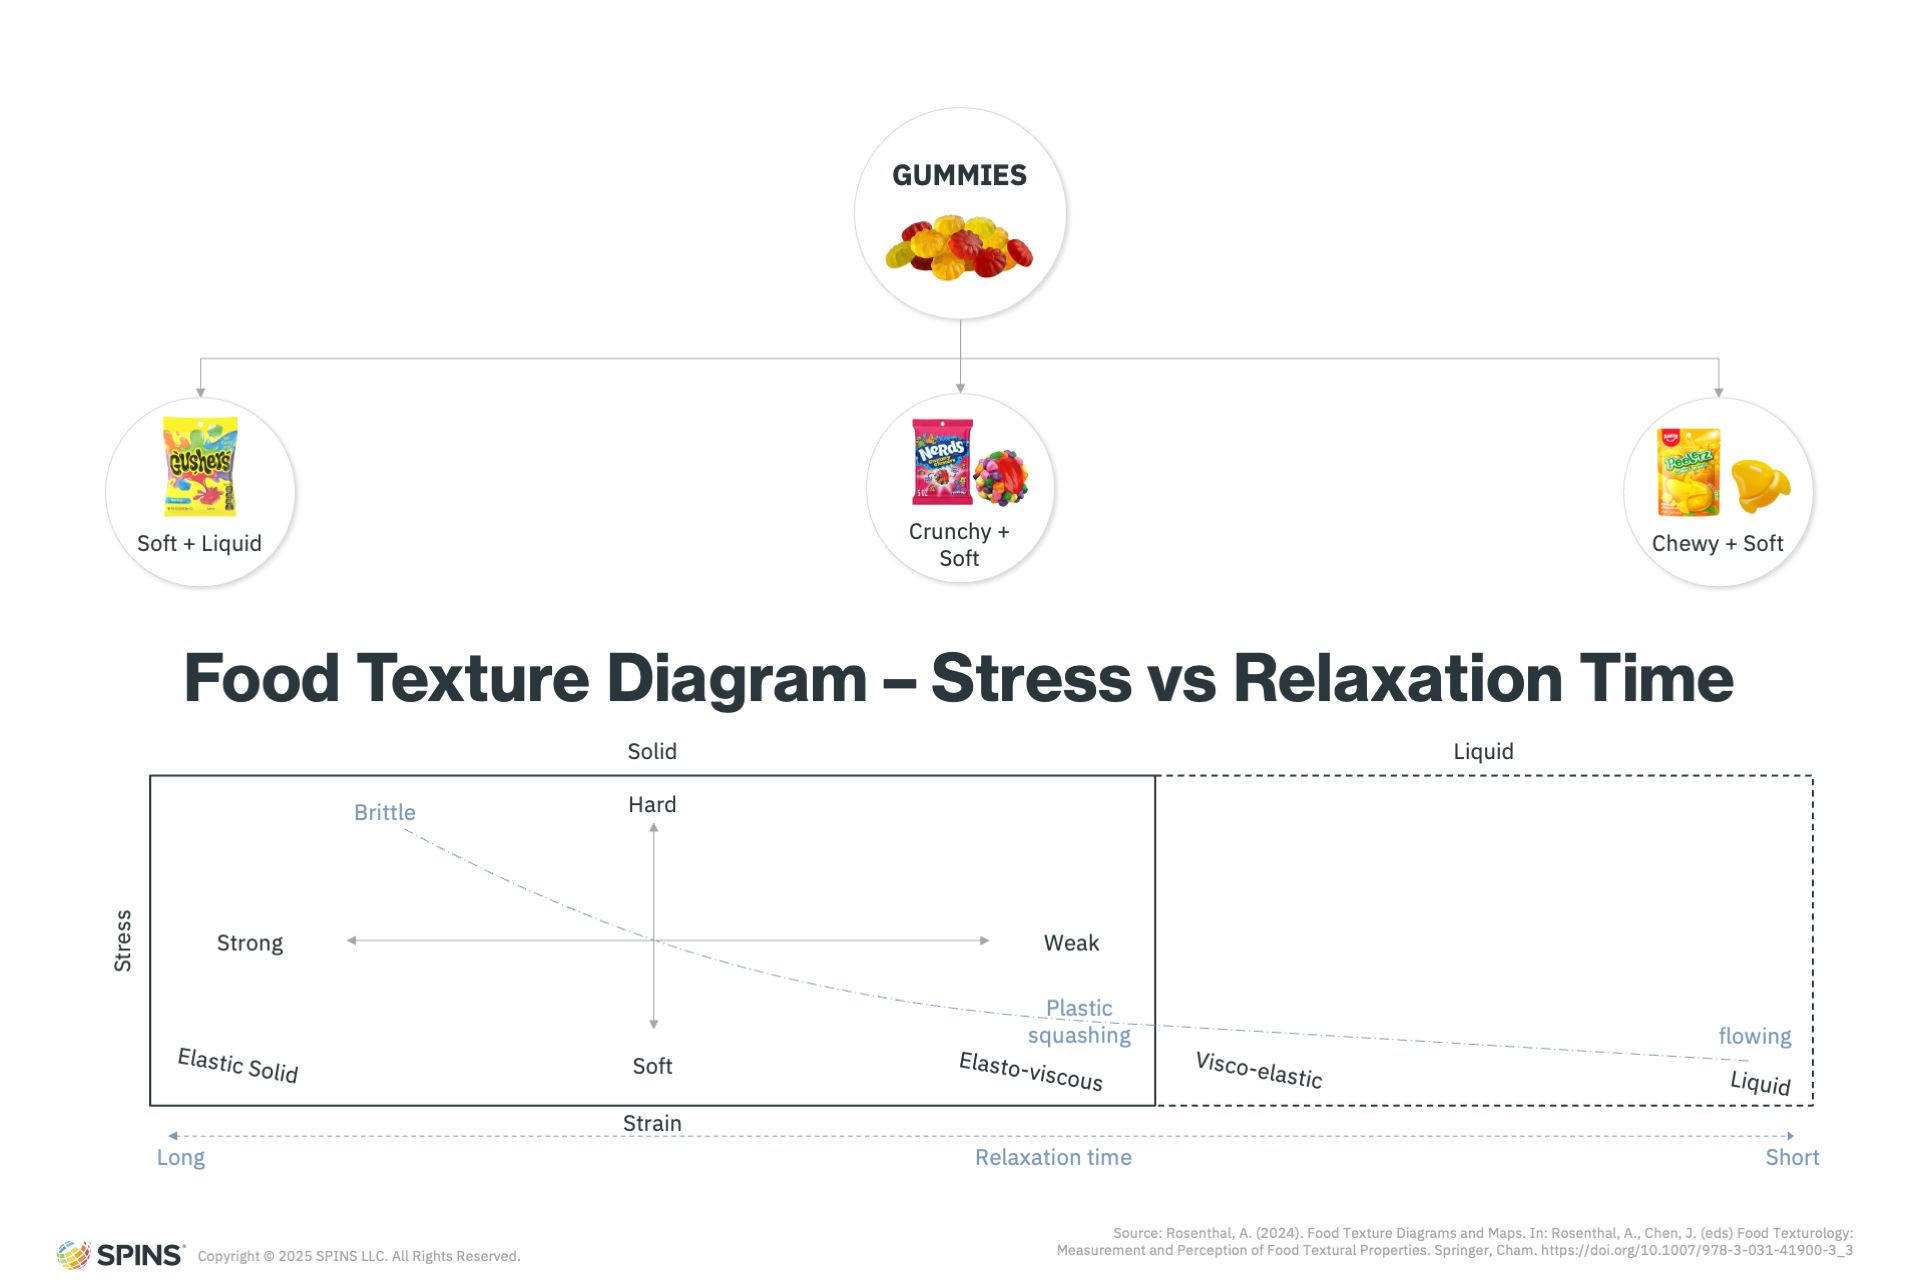
Soft centers, crunchy coatings, and interactive formats like peelable gummies are changing how consumers experience candy. Gummy clusters, for example, revived interest in the segment by combining a nostalgic chew with an unexpected crisp. Peelable gummies introduce playful, multi-layered sensations that appeal to both kids and adults. The innovation in texture here hints at untapped opportunities across the broader snack aisle.
Texture Reimagined
Beyond gummies, other snack categories are also undergoing texture transformations. The early 2010s introduced chewy formats to American palates via mochi and bubble tea, while the 2020s have been defined by contrasting textures, like the crunch of chili crisp in a traditionally liquid condiment category.
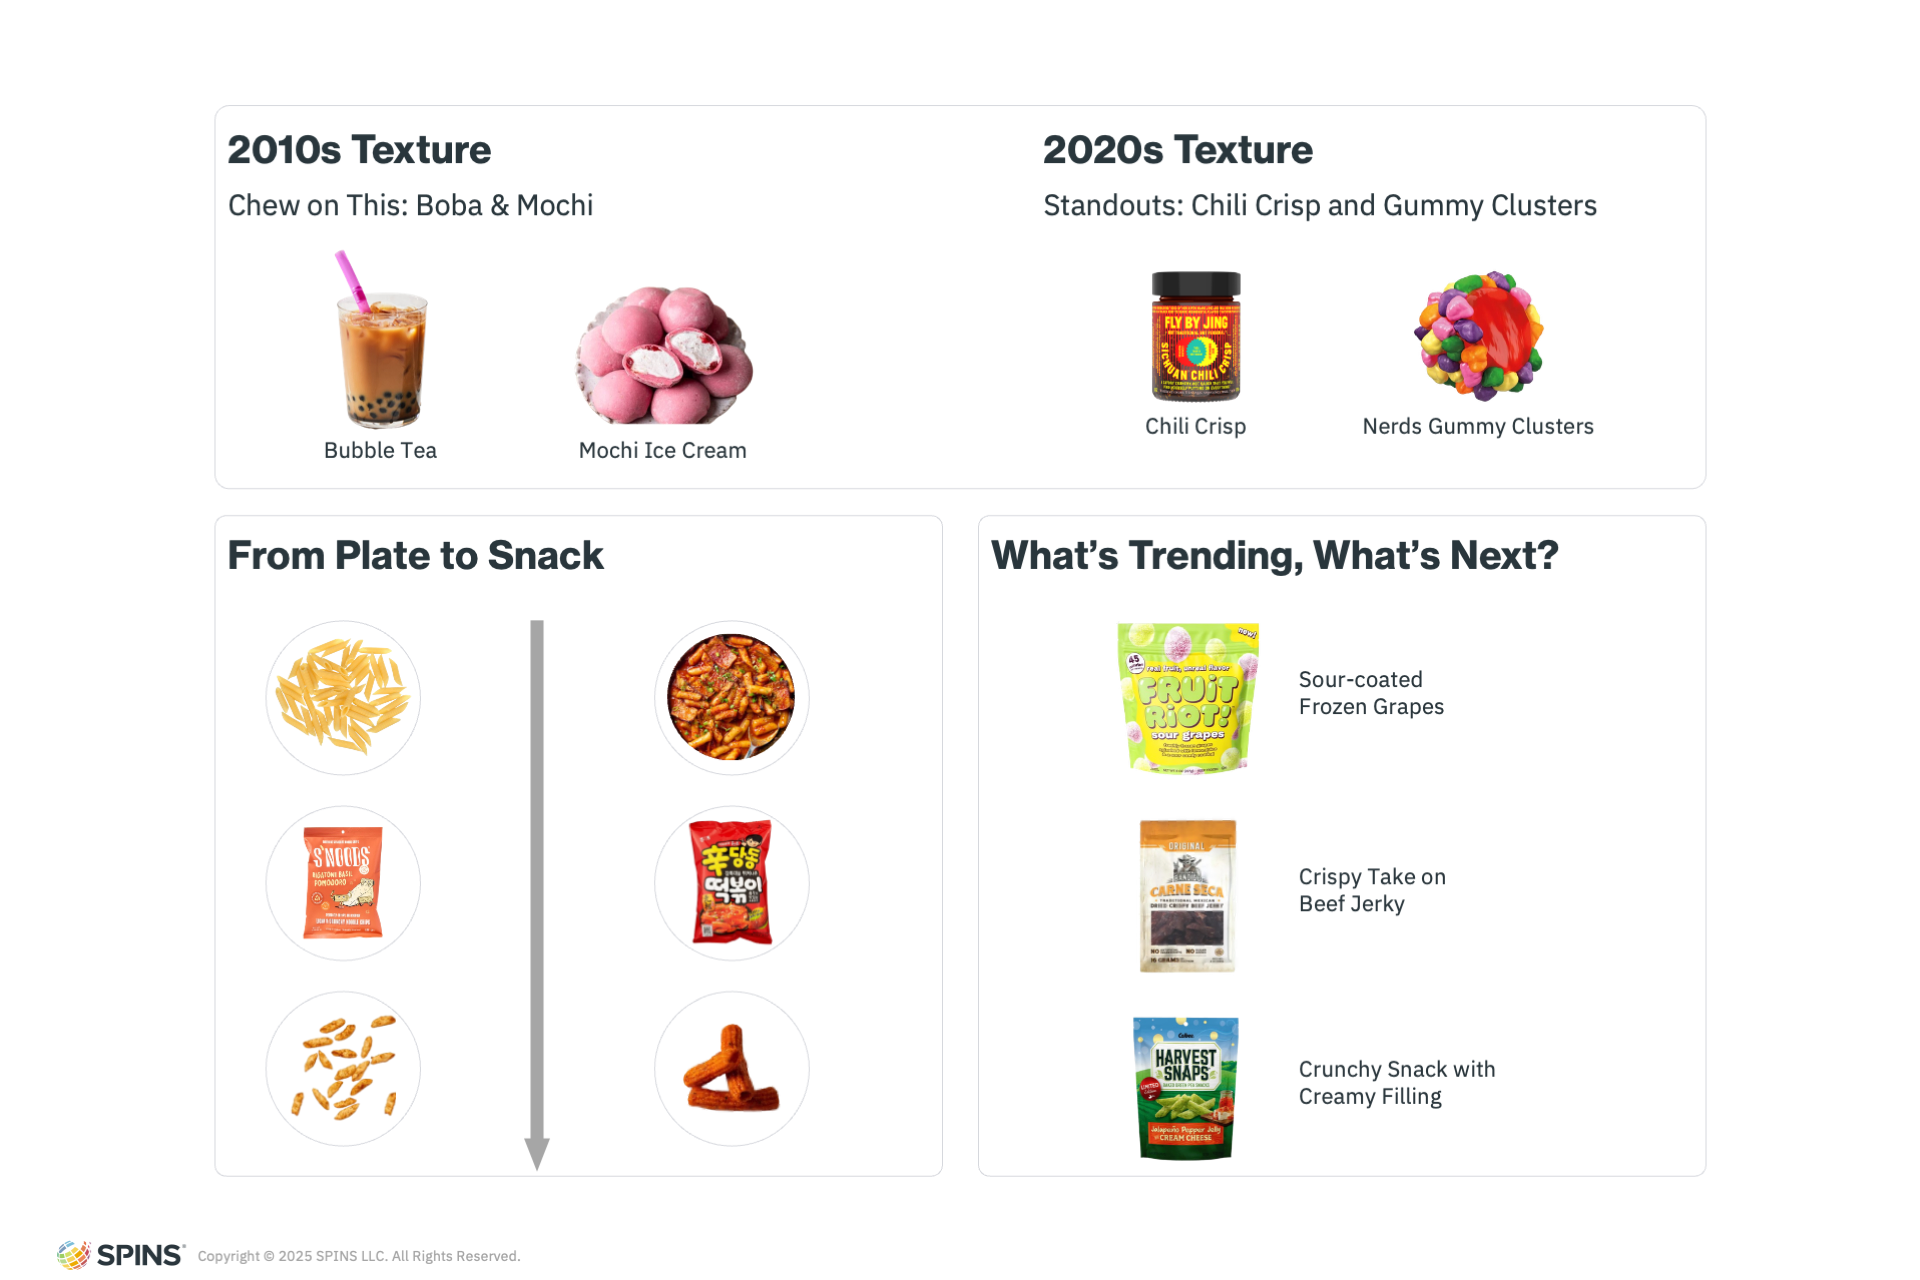
Another driver of this trend is the “plate to snack” concept, where full meals are reinterpreted as snackable formats. Pasta, for example, has been reinvented as a crunchy, air-fried snack thanks to TikTok virality. In Korea, tteokbokki—traditionally a soft rice cake dish—has its own crunchy, snackable counterpart. These transformations speak to the consumer’s desire for familiar flavors in novel formats.
What’s next in the texture revolution? Expect to see continued interest in products like Fruit Riot’s sour-coated frozen grapes, which deliver a tart outer layer with a crunchy frozen bite. Crispy beef jerky, like those by Vaquero Bandido, which is reminiscent of crispy bacon, offers an entirely new entry point into the jerky segment. Another standout is Harvest Snaps’ jalapeño jelly and cream cheese-filled snacks—a true textural adventure with a crunchy exterior and creamy core.
Better-For-You Snacking: Healthier Habits Fuel the Future of Food
As snacking continues to replace traditional meals for many Americans, consumer expectations are evolving. It’s no longer just about convenience or flavor—it’s about function, nutrition, and transparency. In this final chapter of the evolution of snacking, we explore the rising dominance of better-for-you (BFY) products, the ingredients driving innovation, and the health and wellness signals that are reshaping snack aisles across the store.
Outsized Growth of Better-For-You Snacks
With 56% of Americans replacing meals with snacks or smaller eating occasions, the role of snacking has shifted from indulgent treat to functional sustenance. This change presents a significant opportunity for brands to lean into elevated nutrition and better-for-you positioning.
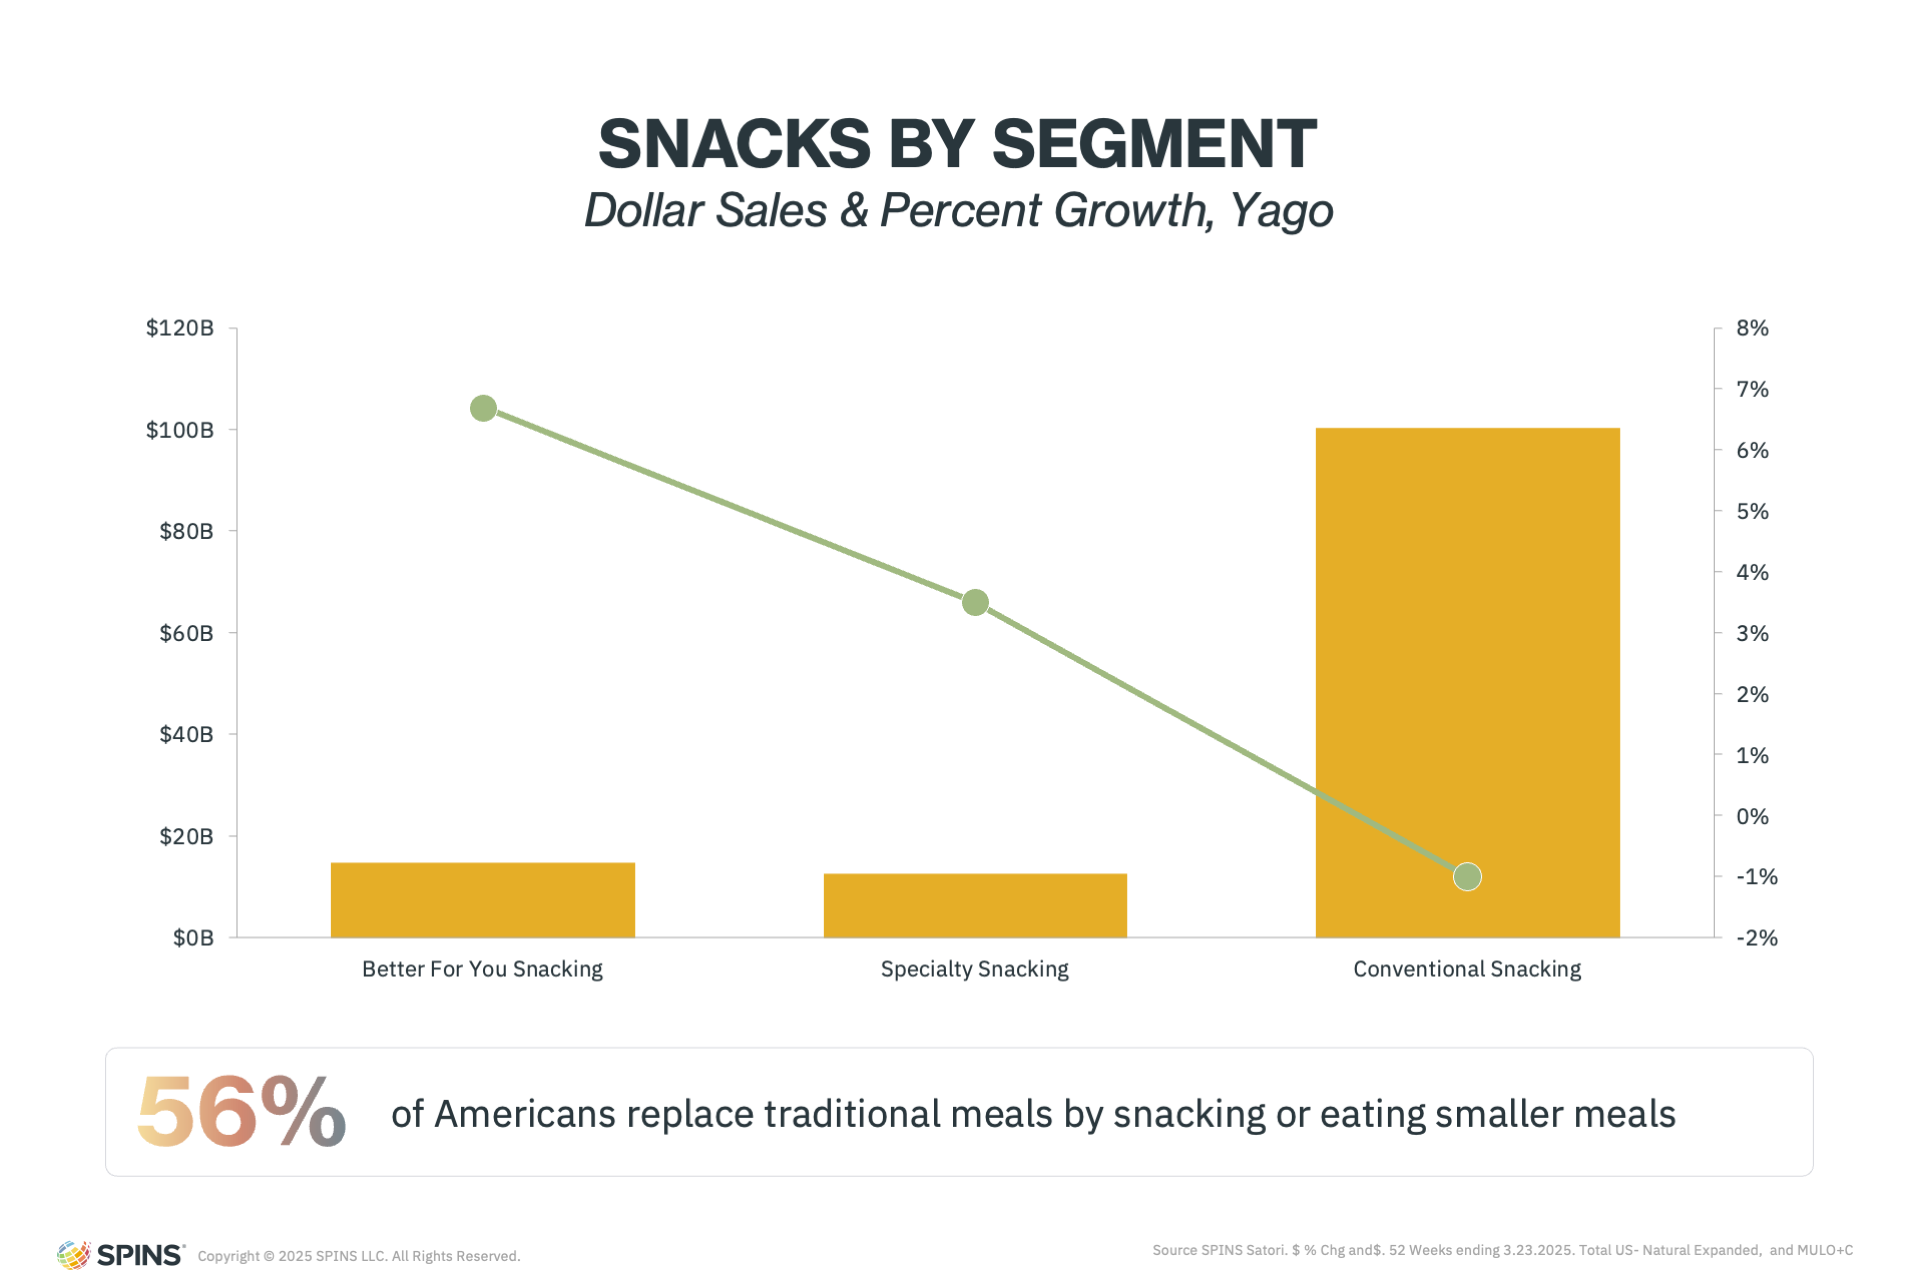
The data reflects this shift clearly. Better-for-you snacking is growing at a 7% rate, while conventional snacks—often lacking clean labels or functional benefits—are seeing slight declines. The consumer’s appetite for BFY options is not only evident, it’s gaining momentum. Brands that align with this demand for nutrient-rich, purposeful snacking are poised for long-term success.
The Strength of Better-For-You Snacks
Better-for-you snacks consistently outperform their total category counterparts, but how those gains appear can vary by segment. In jerky, for example, growth is being driven by attributes like grass-fed, no added sugar, and clean ingredient lists. These differentiators are helping better-for-you jerky significantly outpace the category average.
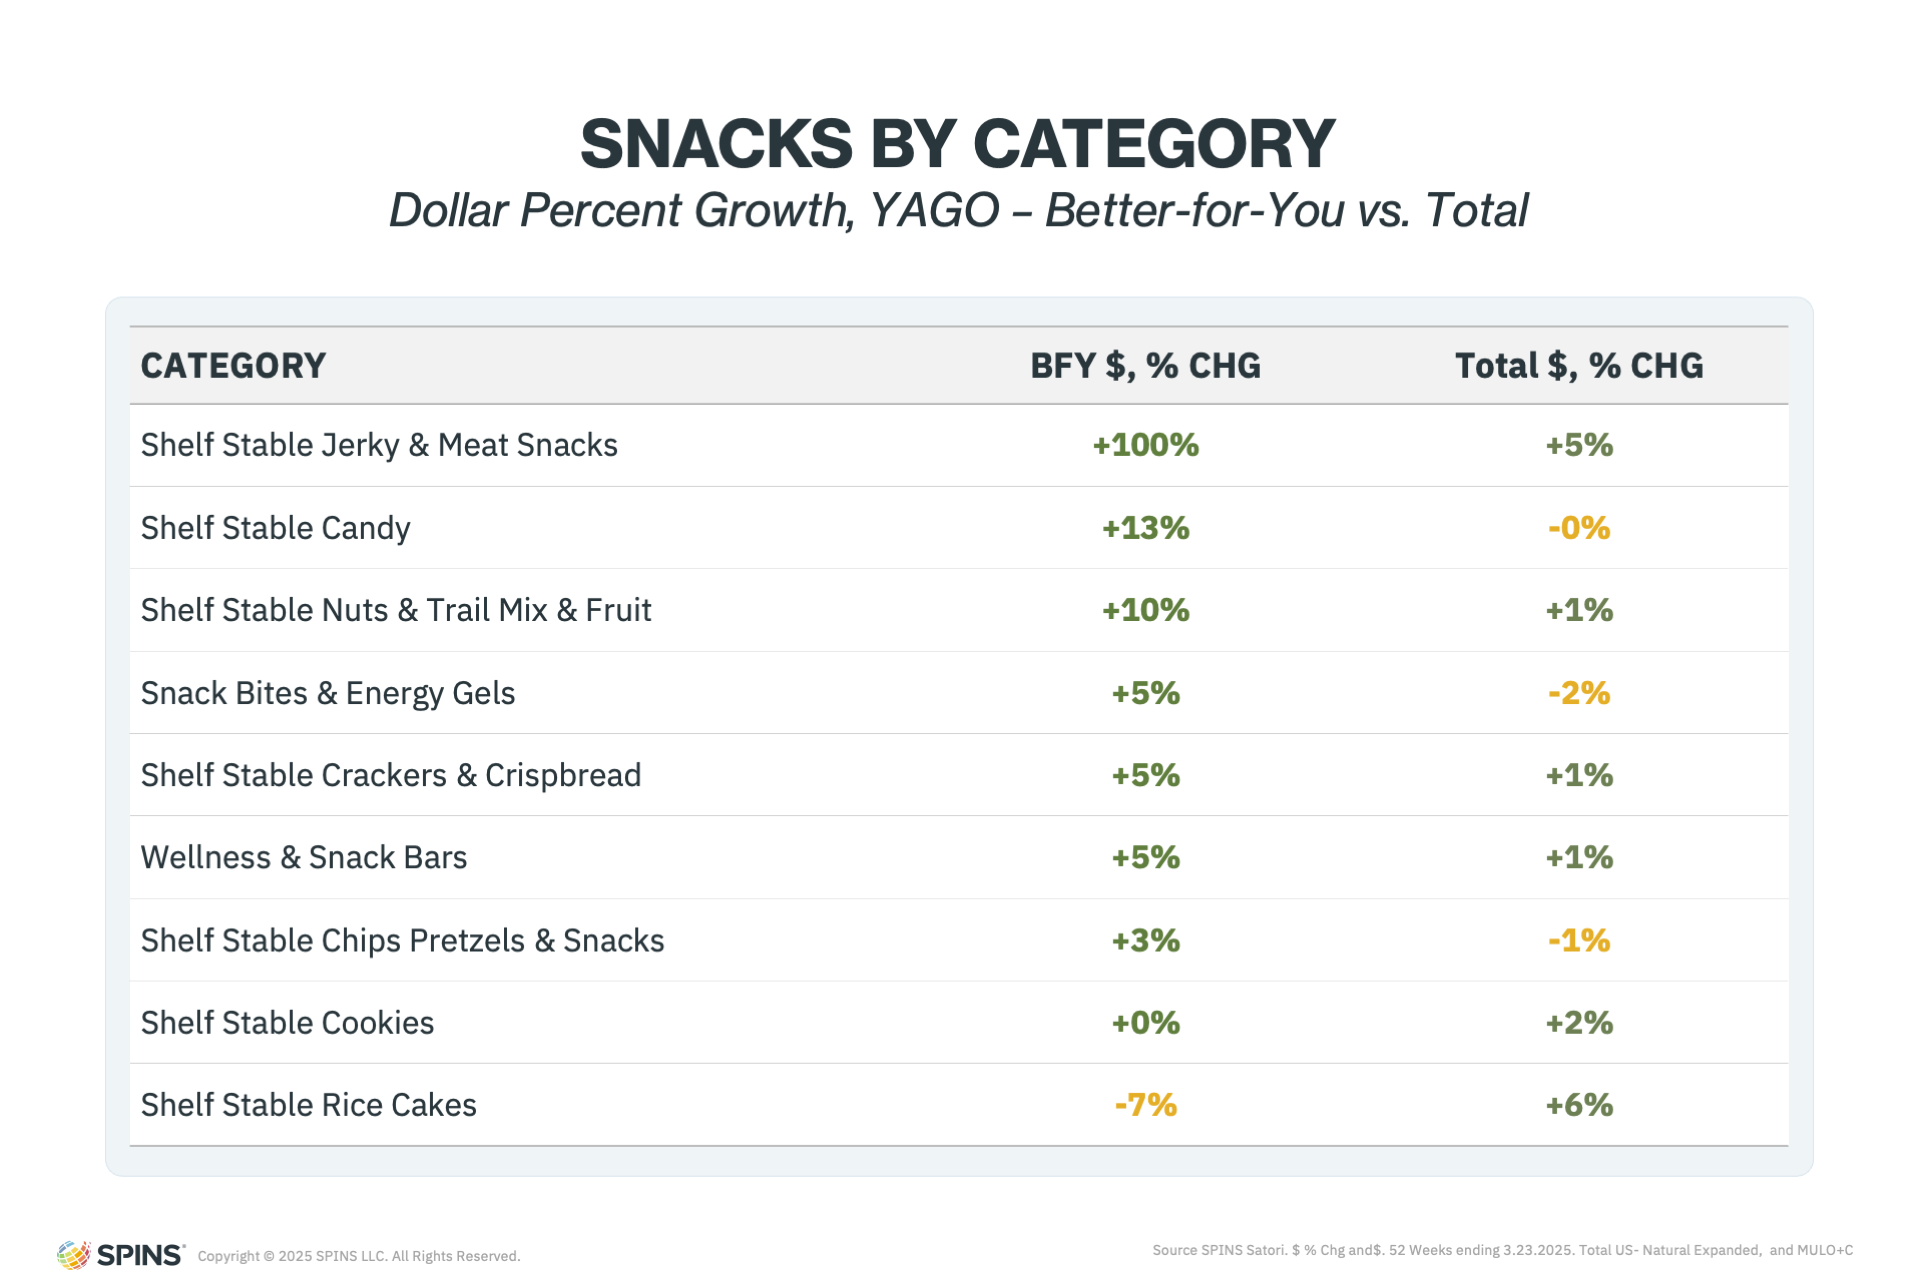
In Candy, the story is slightly different. Clean label credentials, allergen-friendly claims, and reduced-sugar sweeteners are leading the charge. While both categories benefit from BFY innovation, the types of traits that resonate vary, showing that success hinges on understanding how health and wellness translate uniquely within each category.
Crucially, when better-for-you product qualities are clearly differentiated and well-executed, they drive significant growth. Consumers respond strongly when a snack feels like a meaningful upgrade, not just a healthier copy of a conventional product.
Making It Functional
When it comes to functional snacks, we have to remember that we are neither in the supplement or beverage aisle, but that doesn’t mean it can’t deliver functional benefits. While traditional functionality often takes center stage in those other categories, snacking’s sweet spot lies in food-based, whole-food functional ingredients.
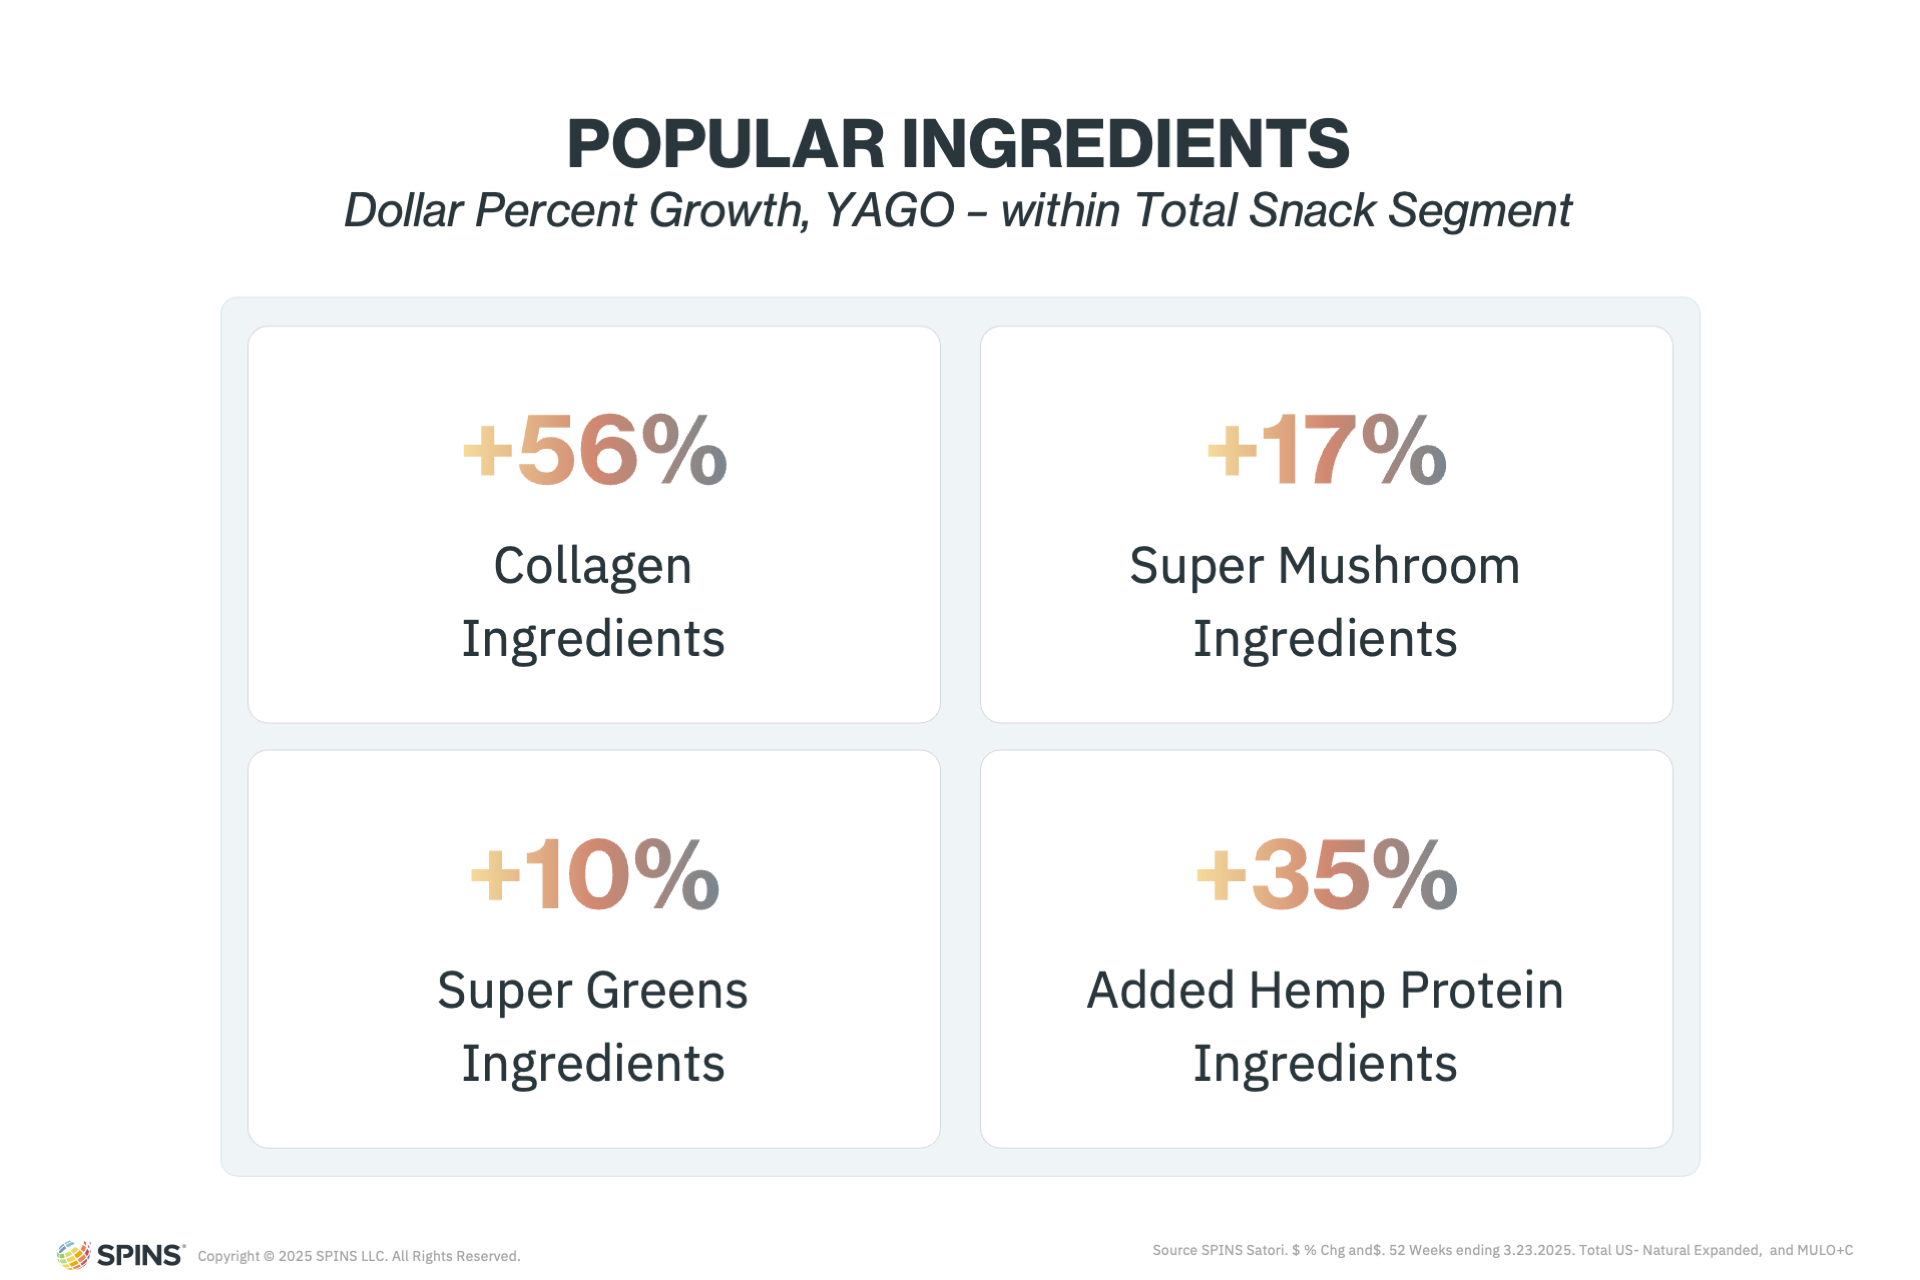
Growth is strong in snacks formulated with collagen or plant-based proteins like hemp. Superfood ingredients—especially mushrooms and greens—continue to perform consistently well, offering both health benefits and sensory appeal. These ingredients not only bring function but also enhance the overall snack experience with flavor, color, and texture.
The integration of superfoods into snack products reflects a natural synergy. Consumers can enjoy the perceived benefits of functional foods without feeling like they’re sacrificing enjoyment or satisfaction. That balance of taste, nutrition, and functionality is key to maintaining momentum in the better-for-you segment.
Nutrition Back in Demand
Nutrient density is once again at the forefront of consumer decision-making. Attributes like high protein, high fiber, low sugar, and low net carbs have been foundational to better-for-you snacking for years, but the demand for these claims is expected to accelerate.
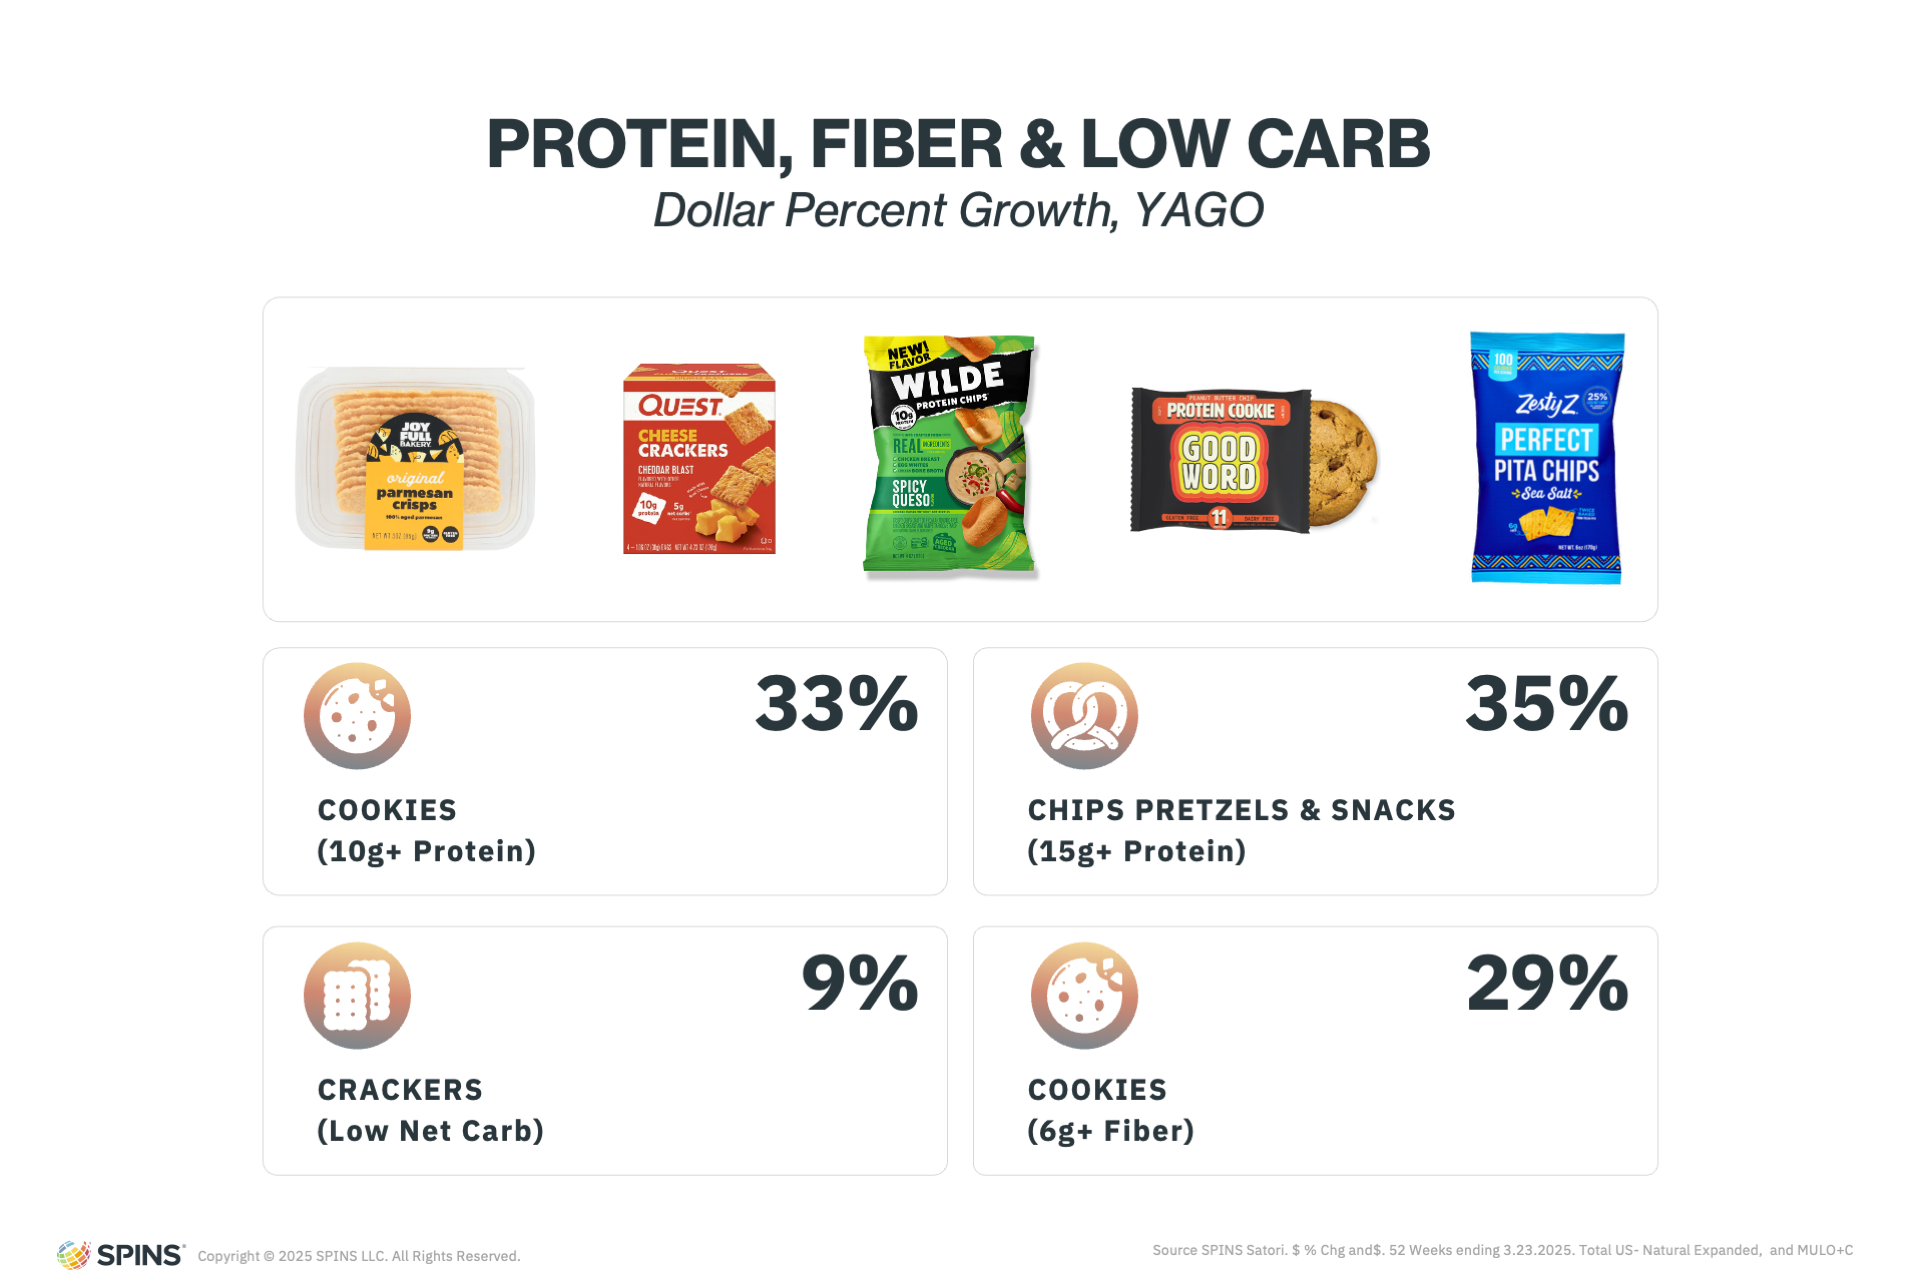
One reason is the growing influence of GLP-1 medications. These appetite-suppressing treatments are creating a new dynamic in consumer food choices, where fewer meals mean each eating occasion must be more nutritionally efficient. This is reinforcing demand for snacks that are not just convenient, but also well-balanced and functional.
As more consumers prioritize satiety and nutrient balance, snacks with high protein content, whole-food ingredients, and reduced sugar will likely gain even more prominence. The foundation has already been laid—now the focus is on building the next generation of elite nutritional snacks that support modern wellness goals.
Souring on Seed Oils
Consumer scrutiny of ingredients continues to intensify, and seed oils are one of the latest interests. The concern centers around two main issues: their highly refined processing (often signaling ultra-processed foods) and their unfavorable omega-6 to omega-3 ratio, which may be linked to inflammation and other health concerns.
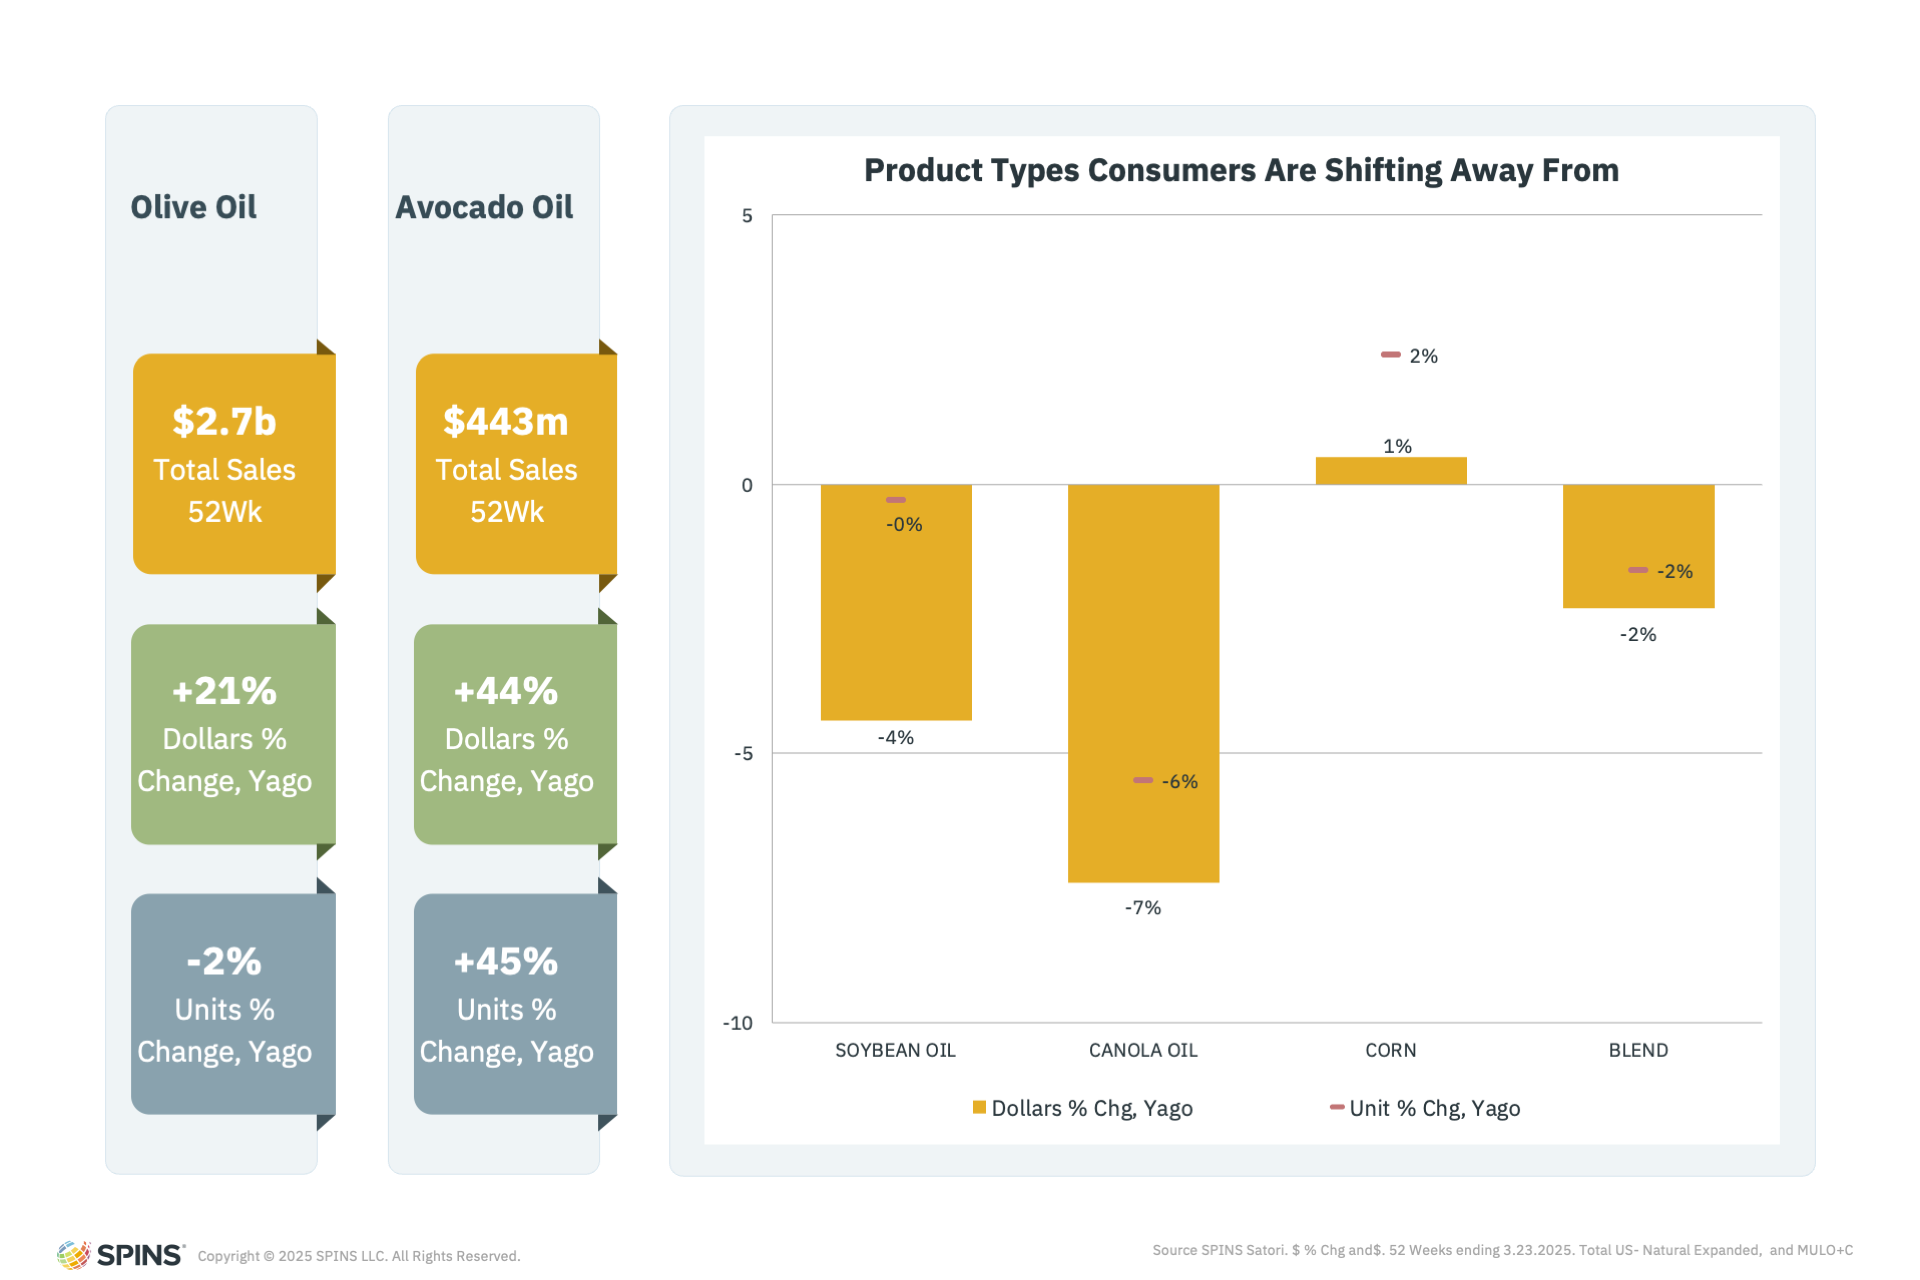
As mainstream awareness grows, shoppers are actively shifting away from seed oils. This trend is already showing up in the shelf-stable oils and vinegars category, where olive and avocado oils are seeing sharp dollar growth, while seed oils remain flat or in decline. However, it is of note that olive oil has seen price increases due to shortages in the past year.
In any case, we can view the shelf-stable oil category as a proxy of what we might soon see play out in the snacks category as well. Brands might swap out canola and soybean oils for avocado or olive oil, and highlight these swaps as key selling points. The push to eliminate or replace seed oils may become a defining feature of future better-for-you innovation, particularly in products like chips, crackers, and popcorn, where oil choice plays a prominent role in formulation.
Quick Note: We’re working on seed oil attribution across hundreds of categories, including snacking, so stay tuned for that!
A New Era of Snacking
Snacking is no longer just about convenience—it’s about purpose. Whether consumers are reaching for a high-protein yogurt, a globally inspired rice cake, or a clean-label gummy, their choices reflect a growing desire for intention. Fresh, flavorful, functional, and better-for-you options are driving this evolution, and brands that respond with innovation and integrity are best positioned to lead.
As the snack aisle continues to expand, one thing is clear: the future of snacking is smarter, more diverse, and undeniably more intentional.