Introduction
Revenue numbers tell a story, but any leadership team knows that they don’t tell the full story. You want to keep those numbers up, but do you know the contributing factors? The most effective way to reach revenue goals is to understand where your business’s strengths and weaknesses are. One growing natural produce brand was ready to dig deeper, so they came to SPINS.
This company works with several farms throughout the country to supply produce to nearby retailers and while their overall numbers were positive, the farm-by-farm figures told a confusing story. Point of sale data showed how much each farm was selling in dollar amounts, but it didn’t show what was driving or slowing that growth. SPINS’ Consumer Insights team knew their industry exclusive combination of panel and natural channel data was the solution.
Are you gaining, retaining, or losing consumers?
Using SPINS natural consumer panel tool, NaturaLink, to get a clear view of the brand’s performance, SPINS completed a New/Lost/Retained analysis of the previous year’s figures. Identifying customer movement in these three areas:
- New: How many new customers purchased products
- Lost: How many customers did not return to purchase products
- Retained: How many existing customers continued to purchase products
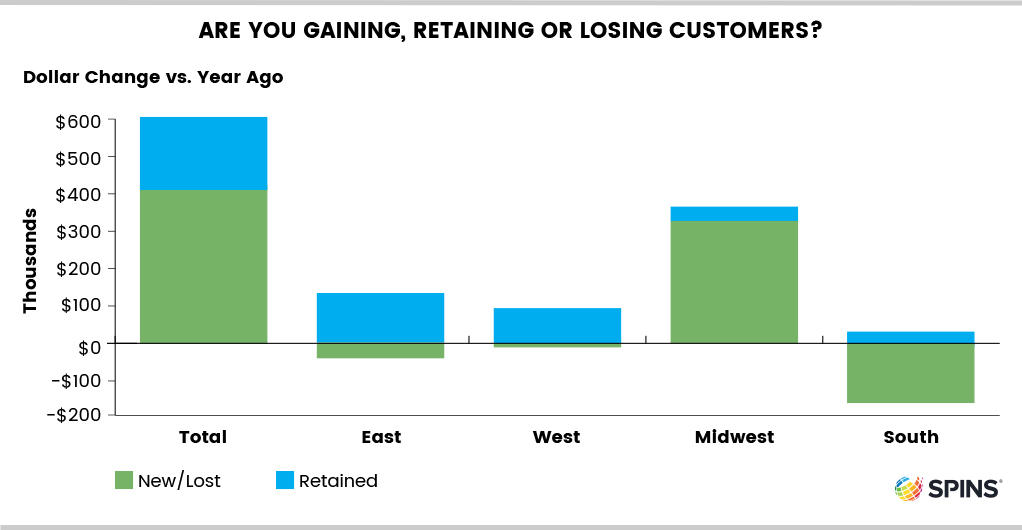
The Consumer Insights team first looked the overall company level metrics. The news was promising: New customers made up 68% of sales, handily outnumbering lost ones, and retained customers signaled a healthy dose of brand loyalty. The SPINS team then separated the sales data by each farm and the picture became clearer. Some of the farms have matured and had a steady flow of retained buyers thanks to longstanding retail relationships. Plus, they also have a healthy number of new customers who offset any losses. Another farm was new and in a growing phase and—as expected—their business came overwhelmingly from new customers.
But another farm was telling a different story. It was the only farm with net negative sales and, although offset by the gains across the rest of the business, was pulling down overall numbers. SPINS’ team used the report to show that something is happening in that lone location and they should get ahead of it before it worsens.
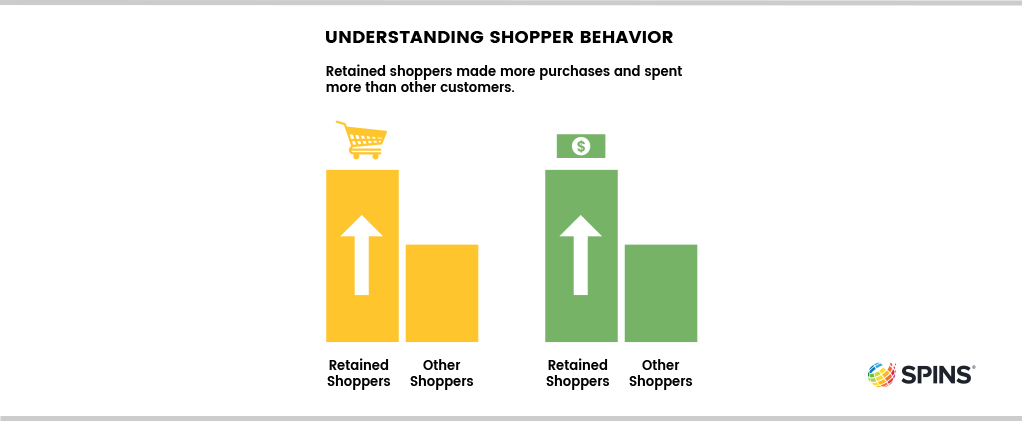
Understanding Shopper Behavior
SPINS’ Consumer Insights team then looked at how shoppers spent their dollars at the company level and at the farm level. They were able to look at New/Lost/Retained across 3 behaviors:
- How much the average buyer spent,
- How much they spent per trip
- How many times they made a purchased during that year.
Buyer behavior helped clarify what was happening in each farm’s market. For example, retained (or returning) customers made more purchases and spent more than other shoppers. However, the numbers looked different in the one under performing farm and made clear the need for a more hands-on approach.
The brand’s executives decided to implement some changes at the one lower performing farm to see if they could counteract the lagging business. After implementing their changes, the company plans to return to SPINS to re-run the analysis and see if they took the right steps.
Consumer Panel data links purchases across trips to unlock behavior patterns and provide deeper insight using the following three features:
Learn more about SPINS’ Consumer Panel solution or contact us to see how we consumer insights can help you grow.