What is it?
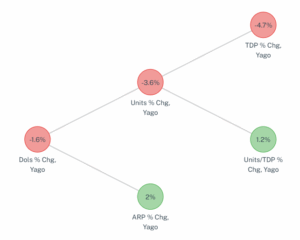
Decomposition trees are a visual way of looking at a category’s performance to quickly discover why it is growing, shrinking, or flat. Dollars are the top point of the tree. Dollar change is influenced by Price (ARP) and Units. Units are further taken apart by distribution and velocity. Decomposition trees are commonly used at the department, category, subcategory, and brand levels.
Why is it important?
Decomposition trees can be used at the category, subcategory, and brand level to visualize the major levers of growth or decline. Analysts familiar with decomposition trees can quickly hypothesize why a category, subcategory, or brand is changing.
What are some examples?
Decomposition trees are found in many dashboards and presentations, and commonly look like this: